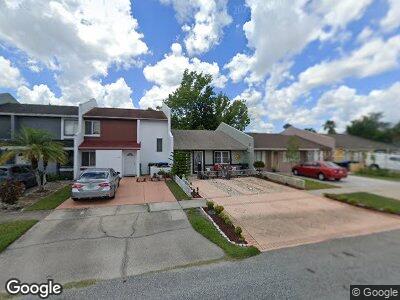
2816 Charing Cross Way Orlando, FL 32837
Estimated Value: $214,513 - $234,000
2
Beds
1
Bath
922
Sq Ft
$238/Sq Ft
Est. Value
About This Home
This home is located at 2816 Charing Cross Way, Orlando, FL 32837 and is currently estimated at $219,628, approximately $238 per square foot. 2816 Charing Cross Way is a home located in Orange County with nearby schools including Waterbridge Elementary School, Freedom Middle School, and Freedom High School.
Ownership History
Date
Name
Owned For
Owner Type
Purchase Details
Closed on
Jul 18, 2006
Sold by
Gonzalez Oyola Awilda
Bought by
Gonzalez Oyola Awilda and Arroyo Christian
Current Estimated Value
Purchase Details
Closed on
Jul 11, 2006
Sold by
Gonzalez Oyola Awilda
Bought by
Gonzalez Oyola Awilda and Arroyo Christian
Purchase Details
Closed on
Sep 23, 2002
Sold by
Luisa Brown I
Bought by
Perez Isabelle
Purchase Details
Closed on
Sep 16, 2002
Sold by
Galvis Luis
Bought by
Gonzalez-Oyola Awilda
Purchase Details
Closed on
Aug 14, 2002
Sold by
Luisa Brown I
Bought by
Perez Isabelle
Purchase Details
Closed on
Feb 21, 1996
Sold by
Marshall Donald I and Marshall Pauline P
Bought by
Daza Amanda and Galvis Luis
Home Financials for this Owner
Home Financials are based on the most recent Mortgage that was taken out on this home.
Original Mortgage
$41,666
Interest Rate
7.03%
Mortgage Type
FHA
Create a Home Valuation Report for This Property
The Home Valuation Report is an in-depth analysis detailing your home's value as well as a comparison with similar homes in the area
Home Values in the Area
Average Home Value in this Area
Purchase History
| Date | Buyer | Sale Price | Title Company |
|---|---|---|---|
| Gonzalez Oyola Awilda | -- | Attorney | |
| Gonzalez Oyola Awilda | -- | Attorney | |
| Perez Isabelle | -- | -- | |
| Gonzalez-Oyola Awilda | $57,000 | -- | |
| Perez Isabelle | $39,000 | -- | |
| Daza Amanda | $40,500 | -- |
Source: Public Records
Mortgage History
| Date | Status | Borrower | Loan Amount |
|---|---|---|---|
| Previous Owner | Daza Amanda | $41,666 |
Source: Public Records
Tax History Compared to Growth
Tax History
| Year | Tax Paid | Tax Assessment Tax Assessment Total Assessment is a certain percentage of the fair market value that is determined by local assessors to be the total taxable value of land and additions on the property. | Land | Improvement |
|---|---|---|---|---|
| 2025 | $643 | $48,724 | -- | -- |
| 2024 | $590 | $48,724 | -- | -- |
| 2023 | $590 | $45,972 | $0 | $0 |
| 2022 | $534 | $44,633 | $0 | $0 |
| 2021 | $515 | $43,333 | $0 | $0 |
| 2020 | $499 | $42,735 | $0 | $0 |
| 2019 | $489 | $41,774 | $0 | $0 |
| 2018 | $478 | $40,995 | $0 | $0 |
| 2017 | $457 | $80,510 | $25,000 | $55,510 |
| 2016 | $412 | $58,592 | $15,000 | $43,592 |
| 2015 | $412 | $49,902 | $11,000 | $38,902 |
| 2014 | $444 | $38,604 | $10,000 | $28,604 |
Source: Public Records
Map
Nearby Homes
- 2803 Charing Cross Way
- 2716 Upsandown St Unit 1
- 11103 Highgate St Unit 1
- 2504 London Bridge Ct
- 2411 Trafalgar Dr
- 11242 Stone Gate Ct
- 11125 Finchley Place
- 2350 Blue Sapphire Cir
- 11110 Essex Ridge Ct
- 2857 Woodruff Dr
- 2600 Pisces Dr Unit 3
- 3502 Windy Walk Way Unit 2307
- 3502 Windy Walk Way Unit 2104
- 11364 Cardiff Dr
- 2424 Barley Club Ct Unit 8
- 2906 Woodruff Dr
- 2408 Barley Club Ct Unit 2
- 2408 Barley Club Ct Unit 7
- 9926 Turf Way Unit 8
- 9918 Turf Way Unit 5
- 2816 Charing Cross Way
- 2812 Charing Cross Way
- 2820 Charing Cross Way
- 2808 Charing Cross Way
- 2824 Charing Cross Way
- 2824 Charing Cross Way Unit 1
- 2806 Charing Cross Way
- 2802 Charing Cross Way
- 2832 Charing Cross Way
- 2809 Charing Cross Way
- 2817 Charing Cross Way Unit 117
- 2817 Charing Cross Way Unit 1
- 2813 Charing Cross Way Unit 1
- 2722 Charing Cross Way
- 2722 Charing Cross Way Unit 1
- 2807 Charing Cross Way
- 2821 Charing Cross Way
- 2718 Charing Cross Way
- 11151 Iron Bridge Rd
- 2804 Grand Bend Ct