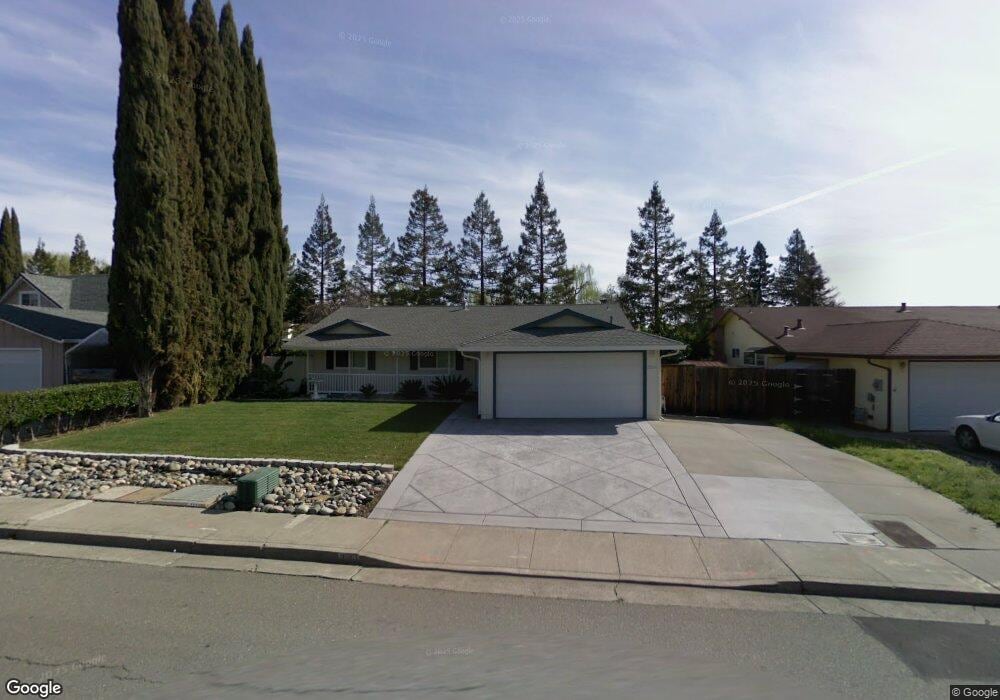
2816 Orchid St Fairfield, CA 94533
Estimated Value: $502,000 - $554,000
4
Beds
2
Baths
1,440
Sq Ft
$364/Sq Ft
Est. Value
About This Home
This home is located at 2816 Orchid St, Fairfield, CA 94533 and is currently estimated at $524,370, approximately $364 per square foot. 2816 Orchid St is a home located in Solano County with nearby schools including Dover Elementary School, Grange Middle School, and Fairfield High School.
Ownership History
Date
Name
Owned For
Owner Type
Purchase Details
Closed on
Jun 30, 2015
Sold by
Rodrigues Kenneth J and Rodrigues Sandra C
Bought by
Peterson Felton B
Current Estimated Value
Home Financials for this Owner
Home Financials are based on the most recent Mortgage that was taken out on this home.
Original Mortgage
$260,000
Outstanding Balance
$202,803
Interest Rate
3.87%
Mortgage Type
FHA
Estimated Equity
$321,567
Create a Home Valuation Report for This Property
The Home Valuation Report is an in-depth analysis detailing your home's value as well as a comparison with similar homes in the area
Home Values in the Area
Average Home Value in this Area
Purchase History
| Date | Buyer | Sale Price | Title Company |
|---|---|---|---|
| Peterson Felton B | $325,000 | Fidelity National Title Co |
Source: Public Records
Mortgage History
| Date | Status | Borrower | Loan Amount |
|---|---|---|---|
| Open | Peterson Felton B | $260,000 |
Source: Public Records
Tax History
| Year | Tax Paid | Tax Assessment Tax Assessment Total Assessment is a certain percentage of the fair market value that is determined by local assessors to be the total taxable value of land and additions on the property. | Land | Improvement |
|---|---|---|---|---|
| 2025 | $4,304 | $384,728 | $59,186 | $325,542 |
| 2024 | $4,304 | $377,185 | $58,026 | $319,159 |
| 2023 | $4,172 | $369,790 | $56,889 | $312,901 |
| 2022 | $4,121 | $362,540 | $55,774 | $306,766 |
| 2021 | $4,081 | $355,432 | $54,681 | $300,751 |
| 2020 | $3,985 | $351,789 | $54,121 | $297,668 |
| 2019 | $3,887 | $344,892 | $53,060 | $291,832 |
| 2018 | $4,012 | $338,130 | $52,020 | $286,110 |
| 2017 | $3,827 | $331,500 | $51,000 | $280,500 |
| 2016 | $3,798 | $325,000 | $50,000 | $275,000 |
| 2015 | $1,248 | $118,532 | $26,380 | $92,152 |
| 2014 | $1,236 | $116,211 | $25,864 | $90,347 |
Source: Public Records
Map
Nearby Homes
- 2731 Orchid St
- 2915 N Texas St Unit 129
- 2915 N Texas St Unit 157
- 2825 Sundown Cir
- 2827 Sunburst Dr
- 432 Chelsea Way
- 278 Jasmine St
- 209 Begonia Blvd
- 500 Asbury Ln
- 393 Manzanita Ave
- 445 Lakehurst Ct
- 570 Berkeley Way
- 2611 Lilac St
- 15 Dali Ct
- 497 Americano Way
- 46 Anza Ct
- 41 Goya Dr
- 50 Anza Ct
- 120 Goya Dr
- 3276 Arroyo Dr
Your Personal Tour Guide
Ask me questions while you tour the home.