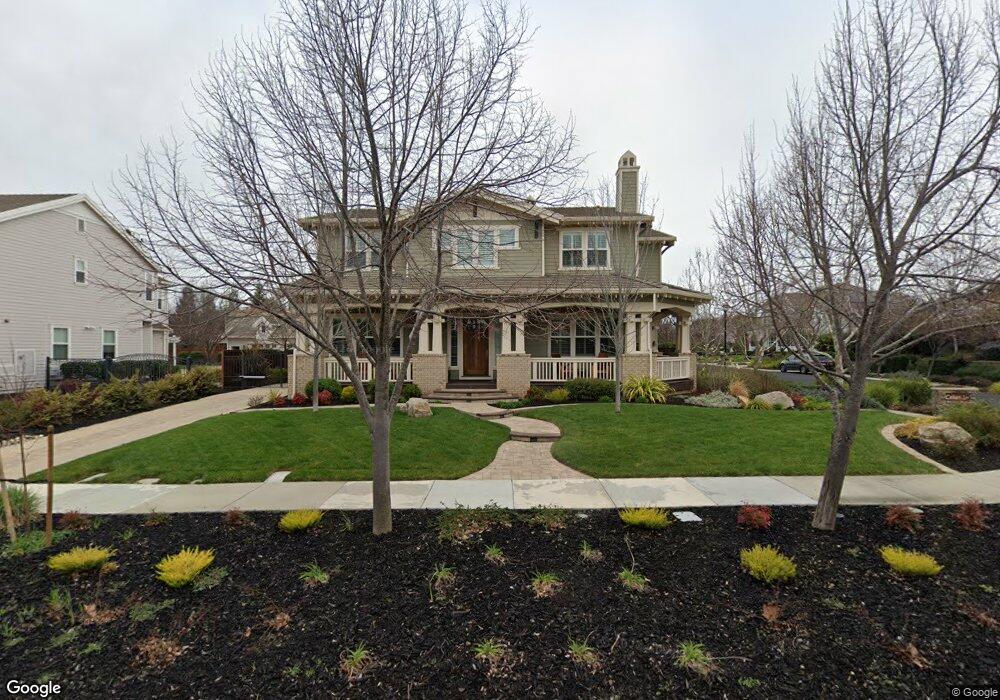
2817 Cellars Dr Livermore, CA 94550
Estimated Value: $2,152,000 - $2,587,000
5
Beds
5
Baths
4,107
Sq Ft
$597/Sq Ft
Est. Value
About This Home
This home is located at 2817 Cellars Dr, Livermore, CA 94550 and is currently estimated at $2,451,928, approximately $597 per square foot. 2817 Cellars Dr is a home located in Alameda County with nearby schools including William Mendenhall Middle School, Granada High School, and St Michael's School.
Ownership History
Date
Name
Owned For
Owner Type
Purchase Details
Closed on
Dec 28, 2016
Sold by
Nunes John A and Nunes Pamela A
Bought by
Nunes John A and Nunes Pamela A
Current Estimated Value
Purchase Details
Closed on
Jul 2, 2008
Sold by
Livermore Corners Lp
Bought by
Nunes John A and Nunes Pamela A
Home Financials for this Owner
Home Financials are based on the most recent Mortgage that was taken out on this home.
Original Mortgage
$417,000
Interest Rate
6.04%
Mortgage Type
Purchase Money Mortgage
Create a Home Valuation Report for This Property
The Home Valuation Report is an in-depth analysis detailing your home's value as well as a comparison with similar homes in the area
Purchase History
| Date | Buyer | Sale Price | Title Company |
|---|---|---|---|
| Nunes John A | -- | None Available | |
| Nunes John A | -- | None Available | |
| Nunes John A | $1,110,000 | First American Title Company |
Source: Public Records
Mortgage History
| Date | Status | Borrower | Loan Amount |
|---|---|---|---|
| Previous Owner | Nunes John A | $417,000 |
Source: Public Records
Tax History
| Year | Tax Paid | Tax Assessment Tax Assessment Total Assessment is a certain percentage of the fair market value that is determined by local assessors to be the total taxable value of land and additions on the property. | Land | Improvement |
|---|---|---|---|---|
| 2025 | $19,005 | $1,497,301 | $428,794 | $1,075,507 |
| 2024 | $19,005 | $1,467,814 | $420,389 | $1,054,425 |
| 2023 | $18,745 | $1,445,900 | $412,147 | $1,033,753 |
| 2022 | $18,465 | $1,410,558 | $404,068 | $1,013,490 |
| 2021 | $17,356 | $1,382,766 | $396,146 | $993,620 |
| 2020 | $17,587 | $1,375,526 | $392,087 | $983,439 |
| 2019 | $17,680 | $1,348,563 | $384,401 | $964,162 |
| 2018 | $17,323 | $1,322,126 | $376,866 | $945,260 |
| 2017 | $16,706 | $1,280,049 | $369,476 | $910,573 |
| 2016 | $16,271 | $1,270,794 | $362,234 | $908,560 |
| 2015 | $15,230 | $1,251,717 | $356,796 | $894,921 |
| 2014 | $14,980 | $1,227,206 | $349,809 | $877,397 |
Source: Public Records
Map
Nearby Homes
- 3075 Olivoro Ct
- 2059 Westbrook Ln
- 2119 Farmington Place
- 1133 Coronado Way Unit 87
- 549 Regulus Rd
- 1443 Wagoner Dr
- 2571 Merlot Ln
- 628 Lido Dr
- 1144 El Dorado Dr
- 221 E Vineyard Ave
- 879 Grace St
- 2772 San Minete Dr
- 1030 Via Madrid
- 255 Prato Way
- 1009 Lisbon Ave
- 2660 Covey Way
- 2352 Gamay Common
- 727 Del Mar Ave
- 342 Kalthoff Common
- 1384 Buckhorn Creek Rd
- 2839 Cellars Dr
- 2783 Cellars Ct
- 1221 Santorino Ct
- 2847 Cellars Dr
- 1210 Santorino Ct
- 1255 Santorino Ct
- 2747 Cellars Ct
- 2792 Cellars Ct
- 2851 Cellars Dr
- 2758 Cellars Ct
- 2709 Cellars Ct
- 1238 Santorino Ct
- 2716 Cellars Ct
- 2838 Cellars Dr
- 2887 Lagiss Ct
- 2539 Regent Rd
- 2843 Lagiss Ct
- 2517 Regent Rd
- 2547 Regent Rd
- 2863 Cellars Dr