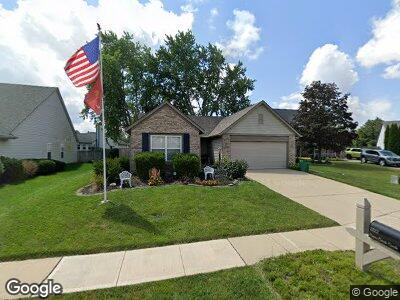
2817 Crosscreek Cir Westfield, IN 46074
East Westfield NeighborhoodEstimated Value: $306,997 - $342,000
4
Beds
2
Baths
1,500
Sq Ft
$215/Sq Ft
Est. Value
About This Home
This home is located at 2817 Crosscreek Cir, Westfield, IN 46074 and is currently estimated at $322,499, approximately $214 per square foot. 2817 Crosscreek Cir is a home located in Hamilton County with nearby schools including Washington Woods Elementary School, Westfield Intermediate School, and Westfield Middle School.
Ownership History
Date
Name
Owned For
Owner Type
Purchase Details
Closed on
Aug 7, 2020
Sold by
Lackey Joseph M
Bought by
Hill Robert B and Hill Dixie L
Current Estimated Value
Home Financials for this Owner
Home Financials are based on the most recent Mortgage that was taken out on this home.
Original Mortgage
$180,000
Outstanding Balance
$161,458
Interest Rate
3%
Mortgage Type
New Conventional
Estimated Equity
$161,041
Purchase Details
Closed on
May 24, 2010
Sold by
Kempson Joshua R
Bought by
Lackey Joseph M
Home Financials for this Owner
Home Financials are based on the most recent Mortgage that was taken out on this home.
Original Mortgage
$120,279
Interest Rate
5.37%
Mortgage Type
FHA
Purchase Details
Closed on
Mar 9, 2010
Sold by
Secretary Of Housing & Urban Development
Bought by
Kempson Joshua R
Purchase Details
Closed on
Sep 30, 2009
Sold by
Everhome Mortgage Company
Bought by
Secretary Of Housing & Urban Development
Purchase Details
Closed on
Jul 23, 2009
Sold by
Holley James L
Bought by
Everhome Mortgage Company
Create a Home Valuation Report for This Property
The Home Valuation Report is an in-depth analysis detailing your home's value as well as a comparison with similar homes in the area
Home Values in the Area
Average Home Value in this Area
Purchase History
| Date | Buyer | Sale Price | Title Company |
|---|---|---|---|
| Hill Robert B | -- | Stewart Title | |
| Lackey Joseph M | -- | First Title Of Indiana Inc | |
| Kempson Joshua R | -- | None Available | |
| Secretary Of Housing & Urban Development | -- | None Available | |
| Everhome Mortgage Company | $124,285 | None Available |
Source: Public Records
Mortgage History
| Date | Status | Borrower | Loan Amount |
|---|---|---|---|
| Open | Hill Robert B | $180,000 | |
| Previous Owner | Lackey Joseph M | $109,000 | |
| Previous Owner | Lackey Joseph M | $120,279 |
Source: Public Records
Tax History Compared to Growth
Tax History
| Year | Tax Paid | Tax Assessment Tax Assessment Total Assessment is a certain percentage of the fair market value that is determined by local assessors to be the total taxable value of land and additions on the property. | Land | Improvement |
|---|---|---|---|---|
| 2024 | $2,716 | $267,700 | $43,700 | $224,000 |
| 2023 | $2,741 | $242,400 | $43,700 | $198,700 |
| 2022 | $2,376 | $205,700 | $43,700 | $162,000 |
| 2021 | $2,118 | $179,300 | $43,700 | $135,600 |
| 2020 | $1,917 | $163,200 | $43,700 | $119,500 |
| 2019 | $1,808 | $153,700 | $26,200 | $127,500 |
| 2018 | $1,656 | $141,300 | $26,200 | $115,100 |
| 2017 | $1,440 | $130,900 | $26,200 | $104,700 |
| 2016 | $1,347 | $122,700 | $26,200 | $96,500 |
| 2014 | $1,272 | $117,100 | $26,200 | $90,900 |
| 2013 | $1,272 | $112,500 | $26,200 | $86,300 |
Source: Public Records
Map
Nearby Homes
- 17918 Lucas Cir
- 701 E Main St
- 17849 Grassy Knoll Dr
- 511 E Main St
- 410 Wood Hollow Ct
- 3581 Free Spirit Ct
- 306 E North St
- 30 Sleepy Hollow Ct
- 3561 Shady Lake Dr
- 338 E Park St
- 345 E Park St
- 306 S Cherry St
- 3577 Idlewind Dr
- 17389 Dallington St
- 17301 Dallington St
- 373 S Cherry St
- 379 S Cherry St
- 17399 Dovehouse Ln
- 367 S Cherry St
- 3849 Sun Valley Dr
- 2817 Crosscreek Cir
- 2817 Cross Creek Cir
- 2825 Crosscreek Cir
- 2809 Crosscreek Cir
- 17733 Willow Creek Way
- 2833 Cross Creek Cir
- 17725 Willow Creek Way
- 2833 Crosscreek Cir
- 2801 Cross Creek Cir
- 2826 Cross Creek Cir
- 2801 Crosscreek Cir
- 2826 Crosscreek Cir
- 2802 Cross Creek Cir
- 2802 Crosscreek Cir
- 2816 Crosscreek Cir
- 17717 Willow Creek Way
- 2841 Crosscreek Cir
- 2808 Cross Creek Cir
- 2840 Crosscreek Cir
- 2808 Crosscreek Cir