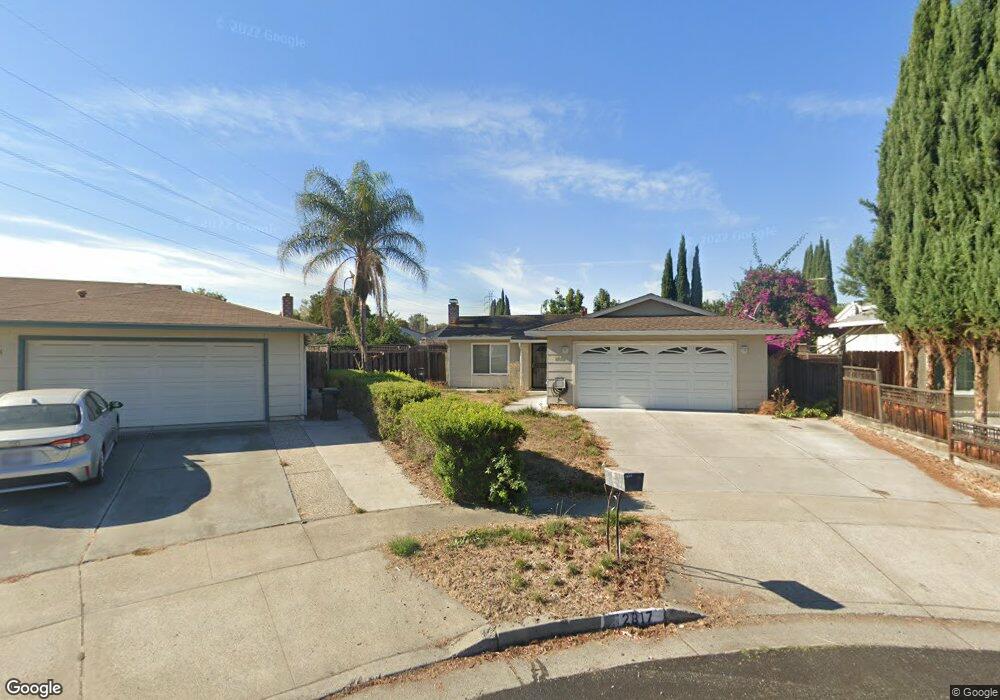
2817 Hamrick Ct San Jose, CA 95121
Leyva NeighborhoodEstimated Value: $892,723 - $1,080,000
2
Beds
1
Bath
800
Sq Ft
$1,226/Sq Ft
Est. Value
About This Home
This home is located at 2817 Hamrick Ct, San Jose, CA 95121 and is currently estimated at $981,181, approximately $1,226 per square foot. 2817 Hamrick Ct is a home located in Santa Clara County with nearby schools including O.B. Whaley Elementary School, George V. Leyva Intermediate School, and Silver Creek High School.
Ownership History
Date
Name
Owned For
Owner Type
Purchase Details
Closed on
Mar 29, 2013
Sold by
Bui Khanh Q
Bought by
Bui Khanh Q and Lam Michelle N
Current Estimated Value
Home Financials for this Owner
Home Financials are based on the most recent Mortgage that was taken out on this home.
Original Mortgage
$134,000
Interest Rate
3.54%
Mortgage Type
New Conventional
Purchase Details
Closed on
Mar 28, 2013
Sold by
Lam Michelle N
Bought by
Bui Khanh Q
Home Financials for this Owner
Home Financials are based on the most recent Mortgage that was taken out on this home.
Original Mortgage
$134,000
Interest Rate
3.54%
Mortgage Type
New Conventional
Purchase Details
Closed on
Sep 10, 2010
Sold by
Do Phong Thanh and Lam Hanh Phuc
Bought by
Bui Khanh Q and Lam Michelle N
Home Financials for this Owner
Home Financials are based on the most recent Mortgage that was taken out on this home.
Original Mortgage
$251,000
Outstanding Balance
$165,827
Interest Rate
4.45%
Mortgage Type
New Conventional
Estimated Equity
$815,354
Purchase Details
Closed on
May 26, 2010
Sold by
Hsbc Bank Usa Na
Bought by
Do Phong Thanh and Lam Hanh Phuc
Purchase Details
Closed on
Nov 12, 2009
Sold by
Zamora Julian J and Zamora Desiree J
Bought by
Hsbc Bank Usa Na
Purchase Details
Closed on
Feb 24, 2005
Sold by
Mitchell Karen and Withrow Kimberly
Bought by
Zamora Julian J and Zamora Desiree J
Home Financials for this Owner
Home Financials are based on the most recent Mortgage that was taken out on this home.
Original Mortgage
$408,000
Interest Rate
6%
Mortgage Type
Purchase Money Mortgage
Purchase Details
Closed on
Feb 26, 2003
Sold by
Murillo Juan Carlos and Murillo Lori Ann
Bought by
Mitchell Karen and Withrow Kimberly
Home Financials for this Owner
Home Financials are based on the most recent Mortgage that was taken out on this home.
Original Mortgage
$324,000
Interest Rate
6.99%
Purchase Details
Closed on
Apr 17, 2000
Sold by
William Peneff
Bought by
Murillo Juan Carlos and Murillo Lori Ann
Home Financials for this Owner
Home Financials are based on the most recent Mortgage that was taken out on this home.
Original Mortgage
$250,000
Interest Rate
8.24%
Purchase Details
Closed on
Sep 8, 1995
Sold by
Peneff Debbie Ann
Bought by
Peneff William
Home Financials for this Owner
Home Financials are based on the most recent Mortgage that was taken out on this home.
Original Mortgage
$112,000
Interest Rate
7.88%
Create a Home Valuation Report for This Property
The Home Valuation Report is an in-depth analysis detailing your home's value as well as a comparison with similar homes in the area
Home Values in the Area
Average Home Value in this Area
Purchase History
| Date | Buyer | Sale Price | Title Company |
|---|---|---|---|
| Bui Khanh Q | -- | None Available | |
| Bui Khanh Q | -- | Fidelity National Title Co | |
| Bui Khanh Q | $321,000 | Chicago Title Company | |
| Do Phong Thanh | $256,500 | Lsi Title Company Ca | |
| Hsbc Bank Usa Na | $223,200 | Accommodation | |
| Zamora Julian J | $510,000 | Financial Title Company | |
| Mitchell Karen | $405,000 | Old Republic Title Company | |
| Murillo Juan Carlos | $298,000 | Fidelity National Title Co | |
| Peneff William | $178,500 | Fidelity National Title Ins |
Source: Public Records
Mortgage History
| Date | Status | Borrower | Loan Amount |
|---|---|---|---|
| Closed | Bui Khanh Q | $134,000 | |
| Open | Bui Khanh Q | $251,000 | |
| Previous Owner | Zamora Julian J | $408,000 | |
| Previous Owner | Mitchell Karen | $324,000 | |
| Previous Owner | Murillo Juan Carlos | $250,000 | |
| Previous Owner | Peneff William | $112,000 | |
| Closed | Mitchell Karen | $60,750 | |
| Closed | Zamora Julian J | $102,000 |
Source: Public Records
Tax History
| Year | Tax Paid | Tax Assessment Tax Assessment Total Assessment is a certain percentage of the fair market value that is determined by local assessors to be the total taxable value of land and additions on the property. | Land | Improvement |
|---|---|---|---|---|
| 2025 | $6,606 | $404,842 | $202,421 | $202,421 |
| 2024 | $6,606 | $396,904 | $198,452 | $198,452 |
| 2023 | $6,455 | $389,122 | $194,561 | $194,561 |
| 2022 | $6,417 | $381,494 | $190,747 | $190,747 |
| 2021 | $6,270 | $374,014 | $187,007 | $187,007 |
| 2020 | $5,989 | $370,180 | $185,090 | $185,090 |
| 2019 | $5,826 | $362,922 | $181,461 | $181,461 |
| 2018 | $5,744 | $355,806 | $177,903 | $177,903 |
| 2017 | $5,647 | $348,830 | $174,415 | $174,415 |
| 2016 | $5,384 | $341,992 | $170,996 | $170,996 |
| 2015 | $5,307 | $336,856 | $168,428 | $168,428 |
| 2014 | $4,748 | $330,258 | $165,129 | $165,129 |
Source: Public Records
Map
Nearby Homes
- 2651 Ophelia Ave
- 1573 Redfield Ct
- 3016 Shadow Springs Place Unit 113
- 3135 Oakbridge Dr Unit 3135
- 2582 Tosca Way
- 3241 Shadow Park Place
- 3032 Oakbridge Dr Unit 3032
- 2130 Pastoral Loop
- 2051 Edgegate Dr
- 2149 Pastoral Loop
- 1520 E Capitol Expy Unit 54
- 2739 Mclaughlin Ave
- 2690 Mclaughlin Ave
- 3261 Everdale Dr
- 1138 Bellingham Dr
- 1079 Drexel Way
- 3556 Squirecreek Cir
- 1497 Meadow Glen Way
- 1498 Sleepy Meadow Ct
- 1227 Letitia Ct
- 2825 Hamrick Ct
- 2809 Hamrick Ct
- 2812 Beecher Ct
- 2828 Beecher Ct
- 2832 Hamrick Ct
- 2801 Hamrick Ct
- 2804 Beecher Ct
- 2836 Beecher Ct
- 2826 Hamrick Ct
- 2818 Hamrick Ct
- 2810 Hamrick Ct
- 2802 Hamrick Ct
- 2863 Armstead Ct
- 2827 Beecher Ct
- 2811 Beecher Ct
- 2854 Longacre Ct
- 2819 Beecher Ct
- 2803 Beecher Ct
- 1657 Jessica Way
- 1653 Jessica Way
Your Personal Tour Guide
Ask me questions while you tour the home.