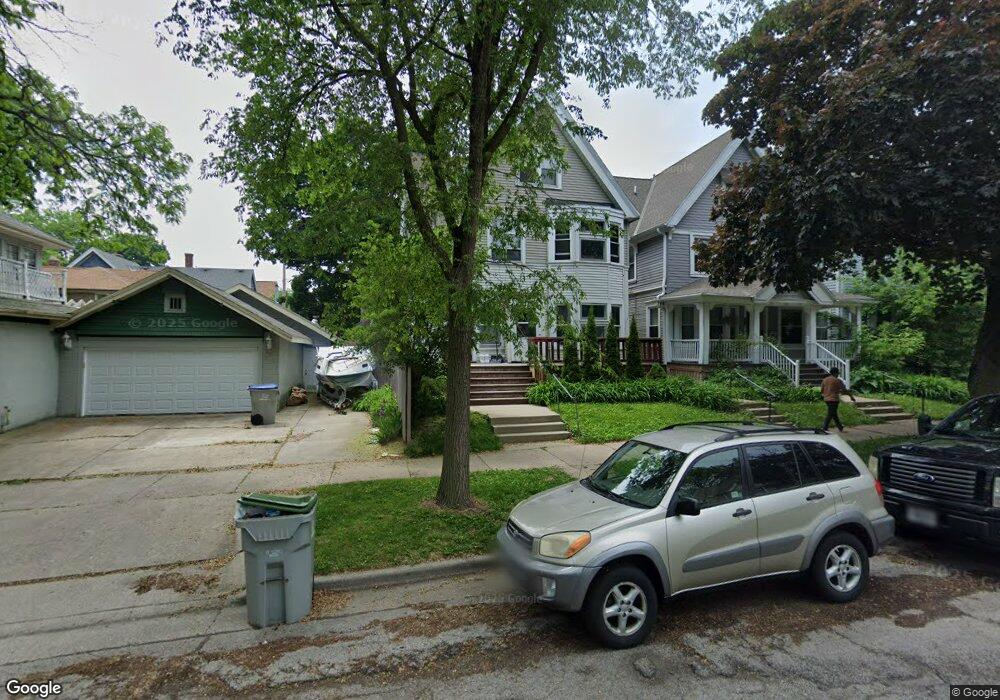
2817 N Cramer St Unit 2819 Milwaukee, WI 53211
Upper East Side NeighborhoodEstimated Value: $351,740 - $444,000
3
Beds
3
Baths
1,100
Sq Ft
$348/Sq Ft
Est. Value
About This Home
This home is located at 2817 N Cramer St Unit 2819, Milwaukee, WI 53211 and is currently estimated at $383,185, approximately $348 per square foot. 2817 N Cramer St Unit 2819 is a home located in Milwaukee County with nearby schools including La Escuela Fratney, Craig Montessori School, and Milwaukee German Immersion School.
Ownership History
Date
Name
Owned For
Owner Type
Purchase Details
Closed on
Sep 5, 2025
Sold by
306 N 71St Street Llc
Bought by
Milwaukee Legacy Llc
Current Estimated Value
Purchase Details
Closed on
May 28, 2025
Sold by
Snoeyenbos Nicholas W
Bought by
306 N 71St Street Llc
Home Financials for this Owner
Home Financials are based on the most recent Mortgage that was taken out on this home.
Original Mortgage
$288,000
Interest Rate
6.83%
Mortgage Type
New Conventional
Purchase Details
Closed on
May 24, 2019
Sold by
Bjll Porperties Llc
Bought by
Snoeyenbos Nicholas and Snoeyenbos Nicholas W
Home Financials for this Owner
Home Financials are based on the most recent Mortgage that was taken out on this home.
Original Mortgage
$257,250
Interest Rate
4.2%
Mortgage Type
FHA
Purchase Details
Closed on
Nov 16, 2015
Sold by
Schmieg Glenn M
Bought by
Bjll Properties Llc
Purchase Details
Closed on
May 30, 2008
Sold by
Belle Properties Llc
Bought by
Schmieg Glenn M
Create a Home Valuation Report for This Property
The Home Valuation Report is an in-depth analysis detailing your home's value as well as a comparison with similar homes in the area
Home Values in the Area
Average Home Value in this Area
Purchase History
| Date | Buyer | Sale Price | Title Company |
|---|---|---|---|
| Milwaukee Legacy Llc | -- | Gowey Abstract & Title | |
| 306 N 71St Street Llc | $360,000 | Focus Title | |
| Snoeyenbos Nicholas | $262,000 | Focus Title Llc | |
| Bjll Properties Llc | $259,900 | Knight Barry Title Inc | |
| Schmieg Glenn M | -- | None Available |
Source: Public Records
Mortgage History
| Date | Status | Borrower | Loan Amount |
|---|---|---|---|
| Previous Owner | 306 N 71St Street Llc | $288,000 | |
| Previous Owner | Snoeyenbos Nicholas | $257,250 |
Source: Public Records
Property History
| Date | Event | Price | List to Sale | Price per Sq Ft |
|---|---|---|---|---|
| 03/23/2026 03/23/26 | Off Market | $1,495 | -- | -- |
| 01/29/2026 01/29/26 | For Rent | $1,495 | -- | -- |
Tax History
| Year | Tax Paid | Tax Assessment Tax Assessment Total Assessment is a certain percentage of the fair market value that is determined by local assessors to be the total taxable value of land and additions on the property. | Land | Improvement |
|---|---|---|---|---|
| 2024 | $8,210 | $361,900 | $88,800 | $273,100 |
| 2023 | $7,429 | $314,400 | $88,800 | $225,600 |
| 2022 | $7,459 | $314,400 | $88,800 | $225,600 |
| 2021 | $7,295 | $280,300 | $70,000 | $210,300 |
| 2020 | $7,260 | $280,300 | $70,000 | $210,300 |
| 2019 | $7,489 | $275,000 | $68,500 | $206,500 |
| 2018 | $7,048 | $275,000 | $68,500 | $206,500 |
| 2017 | $6,752 | $250,000 | $52,800 | $197,200 |
| 2016 | $6,908 | $243,300 | $52,800 | $190,500 |
| 2015 | -- | $243,300 | $52,800 | $190,500 |
| 2014 | -- | $243,300 | $52,800 | $190,500 |
| 2013 | -- | $243,300 | $52,800 | $190,500 |
Source: Public Records
Map
Nearby Homes
- 2865 N Cramer St Unit 2867
- 2736 N Oakland Ave
- 2715 N Oakland Ave
- 1712 E Park Place Unit 1714
- 2706 N Frederick Ave
- 1711 E Belleview Place
- 2735 N Farwell Ave
- 3066 N Newhall St
- 2531 N Murray Ave
- 2498 N Bartlett Ave
- 2744 N Stowell Ave Unit 2746
- 2230 E Bradford Ave Unit G
- 2741 N Hackett Ave
- 2557 N Gordon Place
- 2813 N Humboldt Blvd Unit 2815
- 2834 N Hackett Ave
- 2025 E Greenwich Ave Unit 101
- 2025 E Greenwich Ave Unit 201
- 2715 N Humboldt Blvd
- 2704 N Hackett Ave
- 2817 N Cramer St Unit 2817A
- 2819 N Cramer St Unit Lower
- 2823 N Cramer St
- 2823 N Cramer St Unit St
- 2827 N Cramer St
- 1828 E Newberry Blvd
- 1818 E Newberry Blvd Unit 1820
- 2829 N Cramer St Unit 2831
- 1818-1820-1820 E Newberry Blvd Unit 1820
- 1818-1820-1820 E Newberry Blvd Unit 1818 A
- 2837 N Cramer St Unit 2
- 2812 N Oakland Ave
- 1902 E Newberry Blvd - Lower
- 1806 E Newberry Blvd Unit 1808
- 1900 E Newberry Blvd Unit 1902
- 1900 E Newberry Blvd
- 2828 N Cramer St Unit 2830
- 2828 N Cramer St Unit 1
- 2830 N Cramer St Unit Upper Unit
- 2828 N Cramer St
Your Personal Tour Guide
Ask me questions while you tour the home.