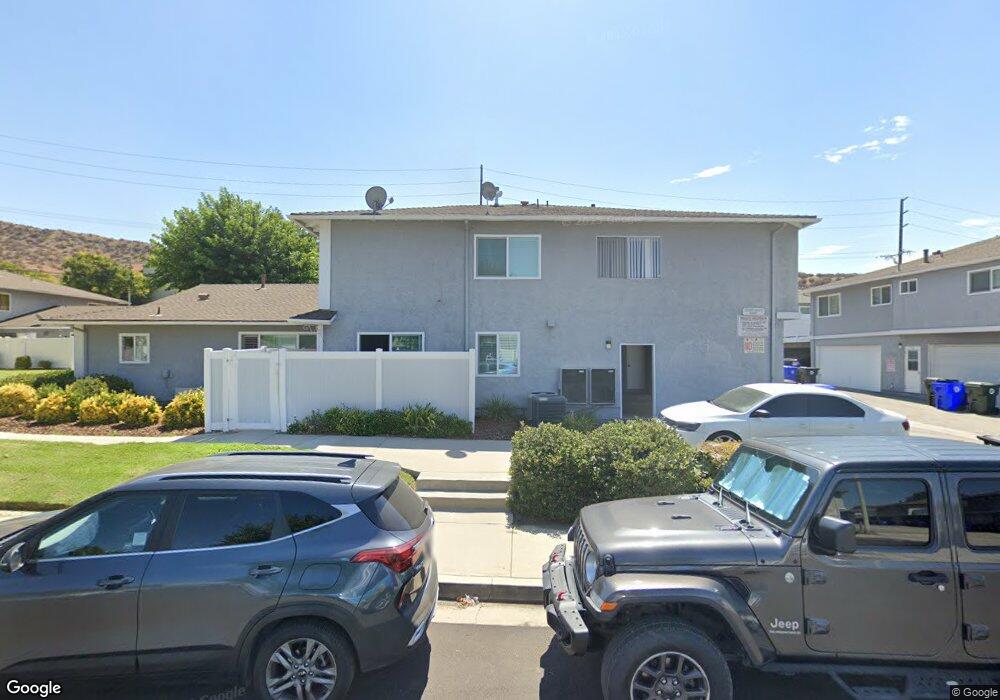
28189 Robin Ave Santa Clarita, CA 91350
Saugus NeighborhoodEstimated Value: $351,000 - $379,000
2
Beds
1
Bath
834
Sq Ft
$441/Sq Ft
Est. Value
About This Home
This home is located at 28189 Robin Ave, Santa Clarita, CA 91350 and is currently estimated at $368,100, approximately $441 per square foot. 28189 Robin Ave is a home located in Los Angeles County with nearby schools including Rosedell Elementary School, Arroyo Seco Junior High School, and Saugus High School.
Ownership History
Date
Name
Owned For
Owner Type
Purchase Details
Closed on
Apr 7, 2009
Sold by
Us Bank National Association
Bought by
Kim Timothy C
Current Estimated Value
Home Financials for this Owner
Home Financials are based on the most recent Mortgage that was taken out on this home.
Original Mortgage
$78,750
Outstanding Balance
$49,407
Interest Rate
4.8%
Mortgage Type
Purchase Money Mortgage
Estimated Equity
$318,693
Purchase Details
Closed on
Jun 11, 2008
Sold by
Peraza David G and Peraza Petra E
Bought by
Us Bank Na and The Structured Asset Investment Loan Tru
Purchase Details
Closed on
Jun 29, 2005
Sold by
Erenberg Jane L
Bought by
Peraza David G
Home Financials for this Owner
Home Financials are based on the most recent Mortgage that was taken out on this home.
Original Mortgage
$212,000
Interest Rate
5.9%
Mortgage Type
Purchase Money Mortgage
Create a Home Valuation Report for This Property
The Home Valuation Report is an in-depth analysis detailing your home's value as well as a comparison with similar homes in the area
Home Values in the Area
Average Home Value in this Area
Purchase History
| Date | Buyer | Sale Price | Title Company |
|---|---|---|---|
| Kim Timothy C | $105,000 | North American Title Co | |
| Us Bank Na | $186,750 | North American Title Co | |
| Peraza David G | $265,000 | -- |
Source: Public Records
Mortgage History
| Date | Status | Borrower | Loan Amount |
|---|---|---|---|
| Open | Kim Timothy C | $78,750 | |
| Previous Owner | Peraza David G | $212,000 | |
| Closed | Peraza David G | $53,000 |
Source: Public Records
Tax History Compared to Growth
Tax History
| Year | Tax Paid | Tax Assessment Tax Assessment Total Assessment is a certain percentage of the fair market value that is determined by local assessors to be the total taxable value of land and additions on the property. | Land | Improvement |
|---|---|---|---|---|
| 2025 | $2,300 | $135,198 | $27,034 | $108,164 |
| 2024 | $2,300 | $132,548 | $26,504 | $106,044 |
| 2023 | $2,215 | $129,950 | $25,985 | $103,965 |
| 2022 | $2,216 | $127,403 | $25,476 | $101,927 |
| 2021 | $2,178 | $124,906 | $24,977 | $99,929 |
| 2019 | $2,107 | $121,203 | $24,237 | $96,966 |
| 2018 | $2,047 | $118,827 | $23,762 | $95,065 |
| 2016 | $1,920 | $114,215 | $22,841 | $91,374 |
| 2015 | $1,850 | $112,500 | $22,498 | $90,002 |
| 2014 | $1,822 | $110,297 | $22,058 | $88,239 |
Source: Public Records
Map
Nearby Homes
- 28144 Alaminos Dr
- 20715 Dot St
- 20623 Russ Jay St
- 28016 Robin Ave
- 20558 Romar Ln
- 20818 Benz Rd
- 28011 Charles Dr
- 0 Plum Canyon Rd
- 27828 Parkvale Dr
- 20220 Arthur Ct
- 20376 Lisa Gail Dr
- 20643 Calhaven Dr
- 20906 Susan Carole Dr
- 21103 Cross Creek Dr
- 28723 Park Woodland Place
- 28647 Visco Ct
- 21123 Avenida de Sonrisa
- 28741 Park Woodland Place
- 20047 Holly Dr
- 21163 Lone Star Way
- 28185 Robin Ave
- 28187 Robin Ave
- 28191 Robin Ave Unit 104
- 28197 Robin Ave
- 28181 Robin Ave
- 28193 Robin Ave
- 28199 Robin Ave Unit 99
- 28183 Robin Ave Unit 108
- 28183 Robin Ave
- 28195 Robin Ave Unit 98
- 28179 Robin Ave
- 28177 Robin Ave
- 28167 Robin Ave
- 28165 Robin Ave
- 28161 Robin Ave
- 20628 Steve Jon St
- 28201 Robin Ave
- 28192 Robin Ave Unit 96
- 28198 Robin Ave
- 28196 Robin Ave