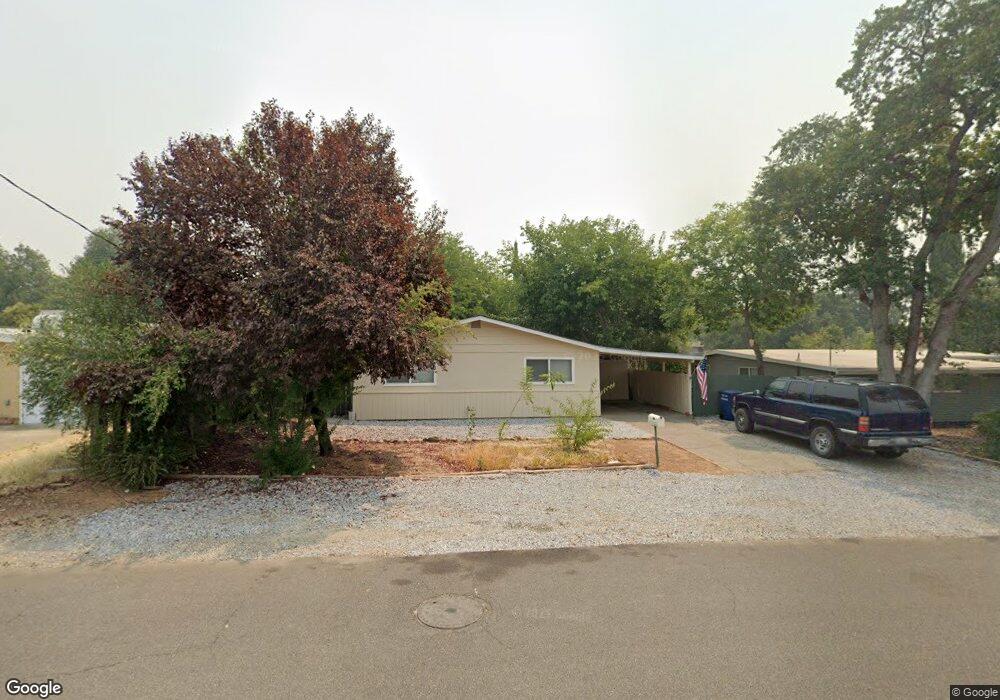
2819 Fairway Ave Redding, CA 96002
Reservoir NeighborhoodEstimated Value: $166,000 - $305,000
3
Beds
1
Bath
1,057
Sq Ft
$232/Sq Ft
Est. Value
About This Home
This home is located at 2819 Fairway Ave, Redding, CA 96002 and is currently estimated at $245,055, approximately $231 per square foot. 2819 Fairway Ave is a home located in Shasta County with nearby schools including Shasta Meadows Elementary School, Parsons Junior High School, and Enterprise High School.
Ownership History
Date
Name
Owned For
Owner Type
Purchase Details
Closed on
Sep 1, 2020
Sold by
Whittaker Andrew N
Bought by
Whittaker Andrew N
Current Estimated Value
Purchase Details
Closed on
Dec 8, 2010
Sold by
Whittaker Karen
Bought by
Whittaker Andrew
Purchase Details
Closed on
Dec 6, 2010
Sold by
U S Bank National Association
Bought by
Whittaker Andrew
Purchase Details
Closed on
Aug 26, 2010
Sold by
Earle Christopher S and Earle Crystel N
Bought by
U S Bank National Association
Purchase Details
Closed on
Oct 24, 2005
Sold by
Birdseye Richard D and Mccurdy Deborah
Bought by
Earle Christopher S and Earle Crystel N
Home Financials for this Owner
Home Financials are based on the most recent Mortgage that was taken out on this home.
Original Mortgage
$172,000
Interest Rate
6.7%
Mortgage Type
Fannie Mae Freddie Mac
Purchase Details
Closed on
Mar 19, 1999
Sold by
Fountain Deborah Lee B
Bought by
Birdseye Richard D and Fountain Deborah Lee B
Create a Home Valuation Report for This Property
The Home Valuation Report is an in-depth analysis detailing your home's value as well as a comparison with similar homes in the area
Home Values in the Area
Average Home Value in this Area
Purchase History
| Date | Buyer | Sale Price | Title Company |
|---|---|---|---|
| Whittaker Andrew N | -- | None Available | |
| Whittaker Andrew | -- | Chicago Title Company | |
| Whittaker Andrew | $65,000 | Chicago Title Company | |
| U S Bank National Association | $99,000 | Stewart Title | |
| Earle Christopher S | $215,000 | First American Title Co | |
| Birdseye Richard D | -- | -- |
Source: Public Records
Mortgage History
| Date | Status | Borrower | Loan Amount |
|---|---|---|---|
| Previous Owner | Earle Christopher S | $172,000 |
Source: Public Records
Tax History Compared to Growth
Tax History
| Year | Tax Paid | Tax Assessment Tax Assessment Total Assessment is a certain percentage of the fair market value that is determined by local assessors to be the total taxable value of land and additions on the property. | Land | Improvement |
|---|---|---|---|---|
| 2025 | $934 | $83,263 | $38,430 | $44,833 |
| 2024 | $921 | $81,631 | $37,677 | $43,954 |
| 2023 | $921 | $80,032 | $36,939 | $43,093 |
| 2022 | $894 | $78,464 | $36,215 | $42,249 |
| 2021 | $864 | $76,926 | $35,505 | $41,421 |
| 2020 | $860 | $76,138 | $35,141 | $40,997 |
| 2019 | $853 | $74,646 | $34,452 | $40,194 |
| 2018 | $843 | $73,183 | $33,777 | $39,406 |
| 2017 | $857 | $71,749 | $33,115 | $38,634 |
| 2016 | $802 | $70,343 | $32,466 | $37,877 |
| 2015 | $796 | $69,288 | $31,979 | $37,309 |
| 2014 | $790 | $67,932 | $31,353 | $36,579 |
Source: Public Records
Map
Nearby Homes
- 2796 Kenco Ave
- 3340 Hartnell Ave
- 1535 E Cypress Ave
- 2820 Alfreda Way
- 3283 Middleton Ln
- 3293 Middleton Ln
- 1703 Cascade Ln
- 3178 Lawrence Rd
- 1221 E Cypress Ave Unit 67
- 2915 Rockabye Ln
- 3341 Timbercreek Dr
- 2953 Churn Ct
- 2308 Hawn Ave
- 1565 Becky Way
- 3466 Silverwood St
- 0 Churn Creek Rd Unit 25-496
- 1091 Del Sol Place
- 2901 Blue View St
- 3475 Oak Haven Ct
- 2919 Blueview St
- 2807 Fairway Ave
- 2831 Fairway Ave
- 2795 Fairway Ave
- 2843 Fairway Ave
- 2822 Robert Ct
- 2810 Robert Ct Unit 1
- 2810 Robert Ct
- 2834 Robert Ct
- 2798 Robert Ct
- 2846 Robert Ct
- 2783 Fairway Ave
- 2822 Fairway Ave
- 2808 Fairway Ave
- 2832 Fairway Ave
- 2859 Fairway Ave
- 2788 Robert Ct
- 2858 Robert Ct
- 2846 Fairway Ave
- 2771 Fairway Ave
- 2786 Fairway Ave