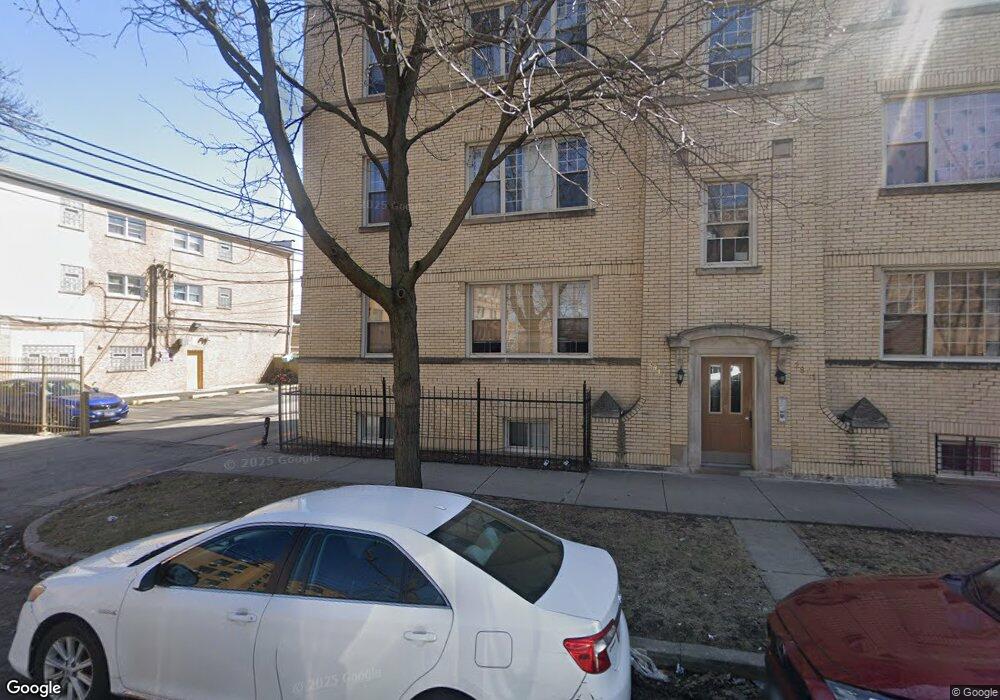
2819 W Rosemont Ave Unit 28191 Chicago, IL 60659
West Ridge NeighborhoodEstimated Value: $147,000 - $179,000
2
Beds
--
Bath
--
Sq Ft
7,667
Sq Ft Lot
About This Home
This home is located at 2819 W Rosemont Ave Unit 28191, Chicago, IL 60659 and is currently estimated at $163,023. 2819 W Rosemont Ave Unit 28191 is a home located in Cook County with nearby schools including Clinton Elementary School, Mather High School, and Yeshivas Tiferes Tzvi Academy.
Ownership History
Date
Name
Owned For
Owner Type
Purchase Details
Closed on
Mar 10, 2023
Sold by
Pacalso Paula Jane and Pacalso Nove A
Bought by
Mohr Eugen
Current Estimated Value
Purchase Details
Closed on
Sep 10, 2021
Sold by
Diekhoff Alex Cody and Diekhoff Kymberly
Bought by
Pacalso Paula Jane and Pacalso Nove
Home Financials for this Owner
Home Financials are based on the most recent Mortgage that was taken out on this home.
Original Mortgage
$86,800
Interest Rate
3.5%
Mortgage Type
New Conventional
Purchase Details
Closed on
Apr 14, 2006
Sold by
Mirza Mohammad B
Bought by
Diekoff Alex Cody and Berson Kymberly
Home Financials for this Owner
Home Financials are based on the most recent Mortgage that was taken out on this home.
Original Mortgage
$135,920
Interest Rate
5.87%
Mortgage Type
Unknown
Purchase Details
Closed on
Dec 16, 2003
Sold by
Cosmopolitan Bank & Trust
Bought by
Mirza Mohammad B
Create a Home Valuation Report for This Property
The Home Valuation Report is an in-depth analysis detailing your home's value as well as a comparison with similar homes in the area
Home Values in the Area
Average Home Value in this Area
Purchase History
| Date | Buyer | Sale Price | Title Company |
|---|---|---|---|
| Mohr Eugen | $136,500 | None Listed On Document | |
| Pacalso Paula Jane | $117,000 | Chicago Title Company | |
| Diekoff Alex Cody | $170,000 | First American Title Ins Co | |
| Mirza Mohammad B | $163,000 | Multiple |
Source: Public Records
Mortgage History
| Date | Status | Borrower | Loan Amount |
|---|---|---|---|
| Previous Owner | Pacalso Paula Jane | $86,800 | |
| Previous Owner | Diekoff Alex Cody | $135,920 |
Source: Public Records
Tax History Compared to Growth
Tax History
| Year | Tax Paid | Tax Assessment Tax Assessment Total Assessment is a certain percentage of the fair market value that is determined by local assessors to be the total taxable value of land and additions on the property. | Land | Improvement |
|---|---|---|---|---|
| 2024 | $2,004 | $10,857 | $1,790 | $9,067 |
| 2023 | $1,954 | $9,500 | $1,451 | $8,049 |
| 2022 | $1,954 | $9,500 | $1,451 | $8,049 |
| 2021 | $1,910 | $9,499 | $1,451 | $8,048 |
| 2020 | $1,643 | $7,377 | $870 | $6,507 |
| 2019 | $1,668 | $8,301 | $870 | $7,431 |
| 2018 | $1,640 | $8,301 | $870 | $7,431 |
| 2017 | $1,185 | $5,503 | $774 | $4,729 |
| 2016 | $1,102 | $5,503 | $774 | $4,729 |
| 2015 | $1,008 | $5,503 | $774 | $4,729 |
| 2014 | $1,579 | $8,508 | $725 | $7,783 |
| 2013 | $1,547 | $8,508 | $725 | $7,783 |
Source: Public Records
Map
Nearby Homes
- 6235 N Mozart St
- 6312 N Fairfield Ave Unit 3B
- 6226 N Mozart St Unit 2N
- 6214 N Mozart St Unit 3E
- 6151 N Mozart St
- 6451 N California Ave Unit 2
- 6215 N Washtenaw Ave
- 6457 N California Ave Unit 3
- 6307 N Talman Ave
- 6212 N Sacramento Ave
- 6400 N Sacramento Ave Unit 205
- 6215 N Talman Ave
- 6508 N Richmond St Unit 1D
- 6414 N Rockwell St
- 6418 N Rockwell St
- 6439 N Rockwell St Unit 2
- 6539 N Sacramento Ave
- 6210 N Albany Ave
- 6504 N Whipple St
- 6144 N Maplewood Ave
- 2819 W Rosemont Ave Unit G
- 2819 W Rosemont Ave Unit 2
- 2821 W Rosemont Ave Unit 2821G
- 2821 W Rosemont Ave Unit 28213
- 2821 W Rosemont Ave Unit 28211
- 2819 W Rosemont Ave Unit 28193
- 2819 W Rosemont Ave Unit 28192
- 2819 W Rosemont Ave Unit 2819G
- 2821 W Rosemont Ave Unit 28212
- 2819 W Rosemont Ave Unit 3
- 2821 W Rosemont Ave Unit 3
- 2821 W Rosemont Ave Unit 2
- 2819 W Rosemont Ave Unit 1
- 2819 W Rosemont Ave Unit G
- 2821 W Rosemont Ave Unit 1
- 2821 W Rosemont Ave Unit G
- 6259 N Mozart St Unit 62593
- 6259 N Mozart St Unit 62592
- 6259 N Mozart St Unit 62591
- 6259 N Mozart St Unit 6259G