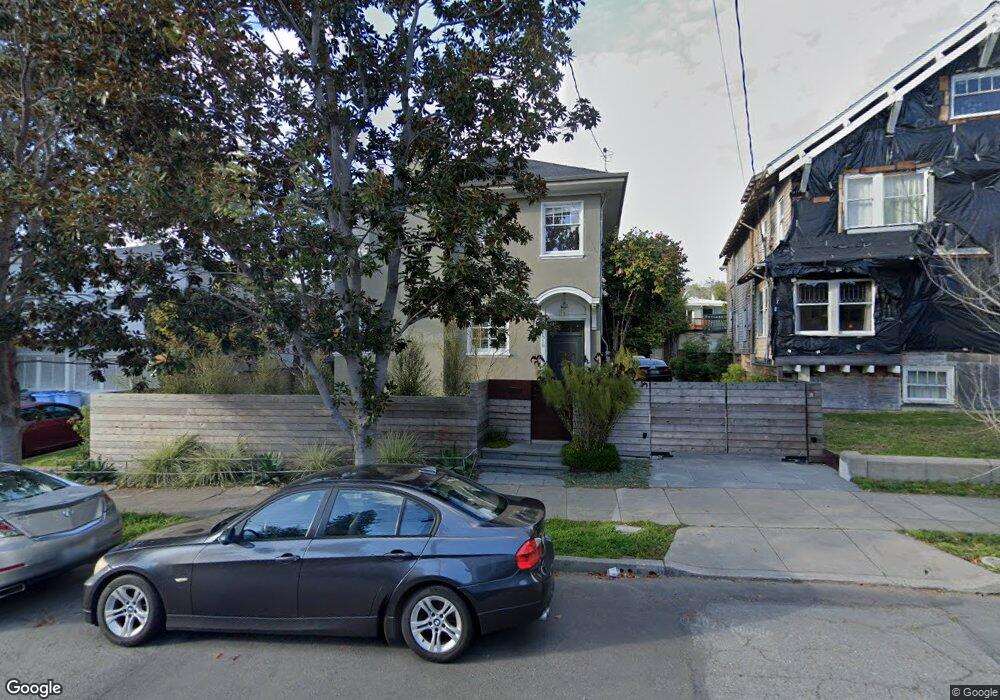
2819 Woolsey St Berkeley, CA 94705
Elmwood NeighborhoodEstimated Value: $3,360,520 - $4,171,000
4
Beds
3
Baths
3,828
Sq Ft
$978/Sq Ft
Est. Value
About This Home
This home is located at 2819 Woolsey St, Berkeley, CA 94705 and is currently estimated at $3,742,380, approximately $977 per square foot. 2819 Woolsey St is a home located in Alameda County with nearby schools including John Muir Elementary School, Emerson Elementary School, and Malcolm X Elementary School.
Ownership History
Date
Name
Owned For
Owner Type
Purchase Details
Closed on
Nov 27, 2024
Sold by
Nguyen Hoai-Luu Q and Lee Wai Kei
Bought by
Nguyen-Lee Living Trust and Lee
Current Estimated Value
Purchase Details
Closed on
Oct 11, 2017
Sold by
Alberti William G and The Wga Survivors Trust
Bought by
Nguyen Hoai Luu Q and The Hoai Luu Q Nguyen Irrevoca
Purchase Details
Closed on
Jun 1, 2013
Sold by
Alberti William G and Alberti Family Living Trust
Bought by
Alberti William G and Wga Survivors Trust
Purchase Details
Closed on
Oct 24, 2003
Sold by
Alberti William G and Alberti Nancy K
Bought by
Alberti William G and Alberti Nancy K
Purchase Details
Closed on
Oct 29, 1993
Sold by
Wilson Derek H
Bought by
Alberti William G and Alberti Nancy K
Create a Home Valuation Report for This Property
The Home Valuation Report is an in-depth analysis detailing your home's value as well as a comparison with similar homes in the area
Home Values in the Area
Average Home Value in this Area
Purchase History
| Date | Buyer | Sale Price | Title Company |
|---|---|---|---|
| Nguyen-Lee Living Trust | -- | None Listed On Document | |
| Nguyen-Lee Living Trust | -- | None Listed On Document | |
| Nguyen Hoai-Luu Q | -- | None Listed On Document | |
| Nguyen Hoai Luu Q | $3,100,000 | Chicago Title Company | |
| Alberti William G | -- | None Available | |
| Alberti William G | -- | -- | |
| Alberti William G | -- | First American Title Co |
Source: Public Records
Tax History
| Year | Tax Paid | Tax Assessment Tax Assessment Total Assessment is a certain percentage of the fair market value that is determined by local assessors to be the total taxable value of land and additions on the property. | Land | Improvement |
|---|---|---|---|---|
| 2025 | $48,853 | $3,532,450 | $1,058,163 | $2,481,287 |
| 2024 | $48,853 | $3,463,050 | $1,037,415 | $2,432,635 |
| 2023 | $47,707 | $3,390,252 | $1,017,075 | $2,373,177 |
| 2022 | $46,930 | $3,316,788 | $997,136 | $2,326,652 |
| 2021 | $47,144 | $3,251,626 | $977,588 | $2,281,038 |
| 2020 | $44,930 | $3,225,240 | $967,572 | $2,257,668 |
| 2019 | $43,514 | $3,162,000 | $948,600 | $2,213,400 |
| 2018 | $42,953 | $3,100,000 | $930,000 | $2,170,000 |
| 2017 | $13,805 | $718,478 | $177,785 | $540,693 |
| 2016 | $13,188 | $704,393 | $174,300 | $530,093 |
| 2015 | $12,969 | $693,815 | $171,682 | $522,133 |
| 2014 | $12,740 | $680,225 | $168,319 | $511,906 |
Source: Public Records
Map
Nearby Homes
- 2962 Piedmont Ave
- 2477 Prince St
- 2817 Palm Ct
- 360 Alcatraz Ave
- 6446 Colby St
- 2643 Stuart St
- 204 El Camino Real
- 2935 Florence St
- 6100 Chabot Rd
- 2632 Warring St Unit 3
- 2917 Telegraph Ave
- 190 Stonewall Rd
- 641 Alvarado Rd
- 1488 Alvarado Rd
- 6189 Margarido Dr
- 2611 Piedmont Ave Unit 4
- 5941 Keith Ave
- 5936 Broadway
- 2601 College Ave Unit 203
- 2601 College Ave Unit 208
- 2817 Woolsey St Unit A
- 2817 Woolsey St Unit A
- 2817 Woolsey St Unit 2817A
- 2817 Woolsey St Unit 2817B
- 2817 Woolsey St Unit C
- 2823 Woolsey St
- 2815 Woolsey St
- 2818 Prince St
- 2816 Prince St
- 2827 Woolsey St
- 2820 Prince St
- 2826 Prince St
- 2822 Prince St Unit 2
- 2814 Prince St
- 2824 Prince St Unit 14
- 2811 Woolsey St
- 2828 Prince St
- 2810 Prince St
- 2842 Woolsey St Unit 2
- 2842 Woolsey St Unit 2
Your Personal Tour Guide
Ask me questions while you tour the home.