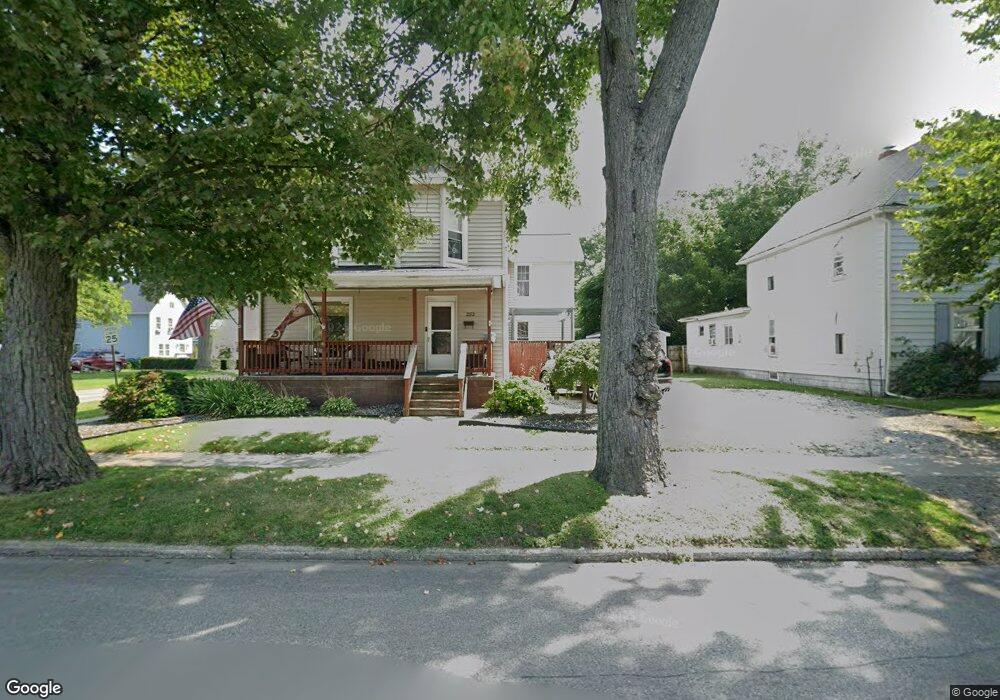
282 Chestnut St Conneaut, OH 44030
Estimated Value: $87,000 - $114,079
4
Beds
2
Baths
2,598
Sq Ft
$40/Sq Ft
Est. Value
About This Home
This home is located at 282 Chestnut St, Conneaut, OH 44030 and is currently estimated at $104,020, approximately $40 per square foot. 282 Chestnut St is a home located in Ashtabula County with nearby schools including Lakeshore Primary Elementary School, Gateway Elementary School, and Conneaut Middle School.
Ownership History
Date
Name
Owned For
Owner Type
Purchase Details
Closed on
Jan 22, 2003
Sold by
Millard Tammy L
Bought by
Millard Ronnie W
Current Estimated Value
Purchase Details
Closed on
Jun 30, 1999
Sold by
Wasson William S
Bought by
Millard Ronnie W and Millard Tammy L
Home Financials for this Owner
Home Financials are based on the most recent Mortgage that was taken out on this home.
Original Mortgage
$86,800
Outstanding Balance
$23,795
Interest Rate
7.29%
Mortgage Type
FHA
Estimated Equity
$80,225
Create a Home Valuation Report for This Property
The Home Valuation Report is an in-depth analysis detailing your home's value as well as a comparison with similar homes in the area
Home Values in the Area
Average Home Value in this Area
Purchase History
| Date | Buyer | Sale Price | Title Company |
|---|---|---|---|
| Millard Ronnie W | -- | -- | |
| Millard Ronnie W | $68,000 | -- |
Source: Public Records
Mortgage History
| Date | Status | Borrower | Loan Amount |
|---|---|---|---|
| Open | Millard Ronnie W | $86,800 |
Source: Public Records
Tax History Compared to Growth
Tax History
| Year | Tax Paid | Tax Assessment Tax Assessment Total Assessment is a certain percentage of the fair market value that is determined by local assessors to be the total taxable value of land and additions on the property. | Land | Improvement |
|---|---|---|---|---|
| 2024 | $2,304 | $31,500 | $2,590 | $28,910 |
| 2023 | $1,492 | $31,500 | $2,590 | $28,910 |
| 2022 | $1,303 | $24,230 | $2,000 | $22,230 |
| 2021 | $1,326 | $24,230 | $2,000 | $22,230 |
| 2020 | $1,325 | $24,230 | $2,000 | $22,230 |
| 2019 | $712 | $12,710 | $1,440 | $11,270 |
| 2018 | $680 | $12,710 | $1,440 | $11,270 |
| 2017 | $679 | $12,710 | $1,440 | $11,270 |
| 2016 | $906 | $18,550 | $2,100 | $16,450 |
| 2015 | $915 | $18,550 | $2,100 | $16,450 |
| 2014 | $810 | $18,550 | $2,100 | $16,450 |
| 2013 | $859 | $20,240 | $2,000 | $18,240 |
Source: Public Records
Map
Nearby Homes
- 536 Madison St
- 495 Main St
- 251 St Rt 7
- 375 Bliss Ave
- 450 Buffalo St
- 474 Sherman St
- 289 Harbor St
- 536 Mill St
- 745 Maple Ave
- 386 Washington St
- 247 Whitney St
- 179 Marshall St
- 143 Evergreen St
- 284 Clay St
- 178 Marshall St
- 146 Nickle Plate Ave
- 427 Harbor St
- 855 Spring St Unit S9
- 404 Viaduct St
- 166 Welton Rd