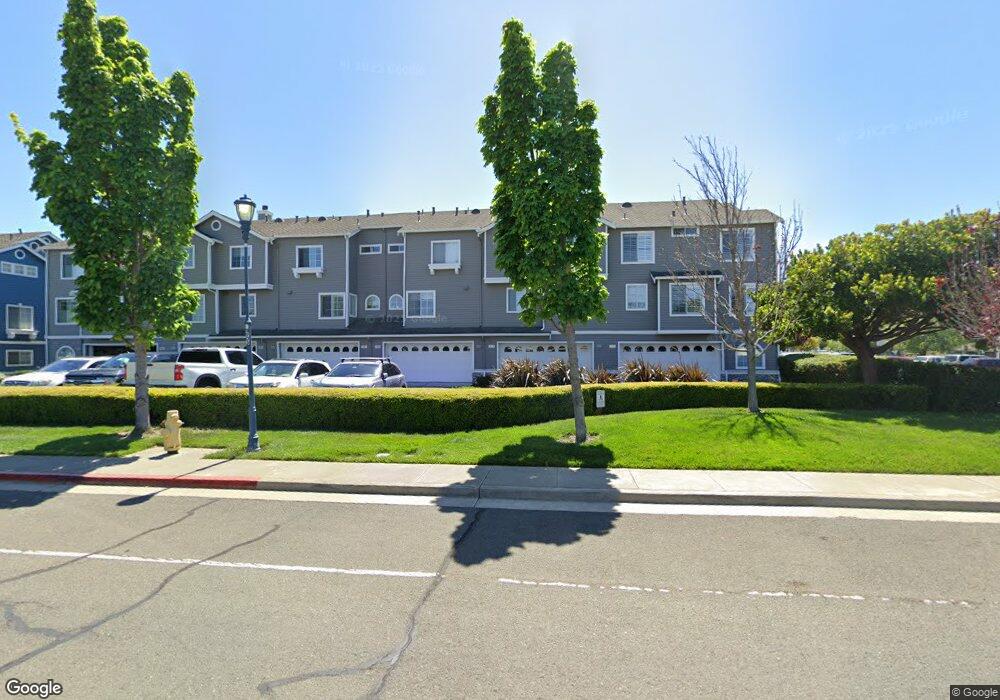
282 E E St Benicia, CA 94510
Estimated Value: $649,000 - $678,959
3
Beds
3
Baths
1,442
Sq Ft
$461/Sq Ft
Est. Value
About This Home
This home is located at 282 E E St, Benicia, CA 94510 and is currently estimated at $665,240, approximately $461 per square foot. 282 E E St is a home located in Solano County with nearby schools including Mary Farmar Elementary School, Benicia Middle School, and Benicia High School.
Ownership History
Date
Name
Owned For
Owner Type
Purchase Details
Closed on
Jun 21, 2010
Sold by
Deutsche Bank National Trust Company
Bought by
Alden Henry G and Alden Lorraine H
Current Estimated Value
Purchase Details
Closed on
Apr 20, 2010
Sold by
Straw0 Gast Susannah Martin and Mcdevitt Mathew Joseph
Bought by
Deutsche Bank National Trust Company
Purchase Details
Closed on
Aug 8, 2005
Sold by
Gizzi Judith M and Stephen Gizzi L
Bought by
Mcdevitt Matthew Joseph and Straw Gast Susannah Martin
Home Financials for this Owner
Home Financials are based on the most recent Mortgage that was taken out on this home.
Original Mortgage
$108,000
Interest Rate
5.48%
Mortgage Type
Stand Alone Second
Purchase Details
Closed on
Jul 22, 2003
Sold by
Kervin John
Bought by
Gizzi L Stephen and Gizzi Judith M
Home Financials for this Owner
Home Financials are based on the most recent Mortgage that was taken out on this home.
Original Mortgage
$300,000
Interest Rate
3.62%
Mortgage Type
Purchase Money Mortgage
Purchase Details
Closed on
Aug 12, 2002
Sold by
Kervin John and Johnson Karen
Bought by
Kervin John
Home Financials for this Owner
Home Financials are based on the most recent Mortgage that was taken out on this home.
Original Mortgage
$345,000
Interest Rate
5.37%
Purchase Details
Closed on
Aug 30, 2001
Sold by
Minyard Ann Wilkerson
Bought by
Kervin John and Johnson Karen
Home Financials for this Owner
Home Financials are based on the most recent Mortgage that was taken out on this home.
Original Mortgage
$342,000
Interest Rate
6.87%
Purchase Details
Closed on
Sep 15, 1998
Sold by
Kaufman & Broad Of Northern Ca Inc
Bought by
Minyard Ann Wilkerson
Home Financials for this Owner
Home Financials are based on the most recent Mortgage that was taken out on this home.
Original Mortgage
$216,681
Interest Rate
6.88%
Create a Home Valuation Report for This Property
The Home Valuation Report is an in-depth analysis detailing your home's value as well as a comparison with similar homes in the area
Home Values in the Area
Average Home Value in this Area
Purchase History
| Date | Buyer | Sale Price | Title Company |
|---|---|---|---|
| Alden Henry G | $256,500 | Chicago Title Company | |
| Deutsche Bank National Trust Company | $207,000 | Landsafe Title | |
| Mcdevitt Matthew Joseph | $540,000 | Chicago Title Co | |
| Gizzi L Stephen | $440,000 | Chicago Title Co | |
| Kervin John | $170,500 | Fidelity Title | |
| Kervin John | $380,000 | Placer Title Company | |
| Minyard Ann Wilkerson | $239,500 | First American Title |
Source: Public Records
Mortgage History
| Date | Status | Borrower | Loan Amount |
|---|---|---|---|
| Previous Owner | Mcdevitt Matthew Joseph | $108,000 | |
| Previous Owner | Mcdevitt Matthew Joseph | $432,000 | |
| Previous Owner | Gizzi L Stephen | $300,000 | |
| Previous Owner | Kervin John | $345,000 | |
| Previous Owner | Kervin John | $342,000 | |
| Previous Owner | Minyard Ann Wilkerson | $216,681 |
Source: Public Records
Tax History
| Year | Tax Paid | Tax Assessment Tax Assessment Total Assessment is a certain percentage of the fair market value that is determined by local assessors to be the total taxable value of land and additions on the property. | Land | Improvement |
|---|---|---|---|---|
| 2025 | $3,858 | $328,612 | $96,082 | $232,530 |
| 2024 | $3,858 | $322,170 | $94,199 | $227,971 |
| 2023 | $3,765 | $315,853 | $92,352 | $223,501 |
| 2022 | $3,695 | $309,661 | $90,542 | $219,119 |
| 2021 | $3,620 | $303,590 | $88,767 | $214,823 |
| 2020 | $3,572 | $300,478 | $87,857 | $212,621 |
| 2019 | $3,510 | $294,587 | $86,135 | $208,452 |
| 2018 | $3,421 | $288,812 | $84,447 | $204,365 |
| 2017 | $3,342 | $283,150 | $82,792 | $200,358 |
| 2016 | $3,365 | $277,599 | $81,169 | $196,430 |
| 2015 | $3,280 | $273,430 | $79,950 | $193,480 |
| 2014 | $3,242 | $268,074 | $78,384 | $189,690 |
Source: Public Records
Map
Nearby Homes
Your Personal Tour Guide
Ask me questions while you tour the home.