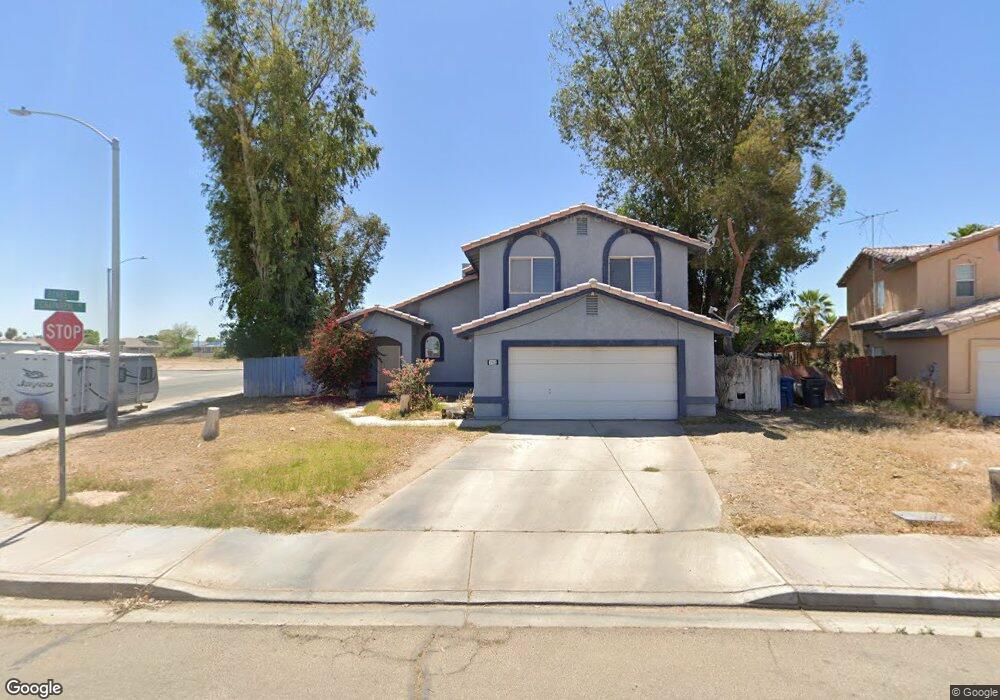
282 Eunice Cir Blythe, CA 92225
Estimated Value: $235,000 - $274,000
3
Beds
3
Baths
1,592
Sq Ft
$160/Sq Ft
Est. Value
About This Home
This home is located at 282 Eunice Cir, Blythe, CA 92225 and is currently estimated at $254,236, approximately $159 per square foot. 282 Eunice Cir is a home located in Riverside County with nearby schools including Palo Verde High School and Scale Leadership Academy - East.
Ownership History
Date
Name
Owned For
Owner Type
Purchase Details
Closed on
May 8, 2002
Sold by
Singh Karnail
Bought by
Mathew Mony
Current Estimated Value
Home Financials for this Owner
Home Financials are based on the most recent Mortgage that was taken out on this home.
Original Mortgage
$120,650
Outstanding Balance
$50,479
Interest Rate
6.94%
Estimated Equity
$203,757
Purchase Details
Closed on
Apr 19, 2002
Sold by
Breshears Kelly L and Breshears Monika
Bought by
Mathew Mony
Home Financials for this Owner
Home Financials are based on the most recent Mortgage that was taken out on this home.
Original Mortgage
$120,650
Outstanding Balance
$50,479
Interest Rate
6.94%
Estimated Equity
$203,757
Purchase Details
Closed on
Aug 19, 1994
Sold by
Siefker Development Co Inc
Bought by
Breshears Kelly L and Breshears Monika
Home Financials for this Owner
Home Financials are based on the most recent Mortgage that was taken out on this home.
Original Mortgage
$111,023
Interest Rate
8.73%
Mortgage Type
Assumption
Create a Home Valuation Report for This Property
The Home Valuation Report is an in-depth analysis detailing your home's value as well as a comparison with similar homes in the area
Home Values in the Area
Average Home Value in this Area
Purchase History
| Date | Buyer | Sale Price | Title Company |
|---|---|---|---|
| Mathew Mony | -- | First American Title Co | |
| Mathew Mony | $127,000 | First American Title | |
| Breshears Kelly L | $108,000 | First American Title Ins Co |
Source: Public Records
Mortgage History
| Date | Status | Borrower | Loan Amount |
|---|---|---|---|
| Open | Mathew Mony | $120,650 | |
| Previous Owner | Breshears Kelly L | $111,023 |
Source: Public Records
Tax History
| Year | Tax Paid | Tax Assessment Tax Assessment Total Assessment is a certain percentage of the fair market value that is determined by local assessors to be the total taxable value of land and additions on the property. | Land | Improvement |
|---|---|---|---|---|
| 2025 | $2,064 | $189,495 | $45,781 | $143,714 |
| 2023 | $2,064 | $182,139 | $44,004 | $138,135 |
| 2022 | $1,961 | $176,769 | $43,142 | $133,627 |
| 2021 | $1,910 | $173,304 | $42,297 | $131,007 |
| 2020 | $1,890 | $171,528 | $41,864 | $129,664 |
| 2019 | $1,873 | $168,166 | $41,044 | $127,122 |
| 2018 | $1,755 | $164,870 | $40,240 | $124,630 |
| 2017 | $1,718 | $161,638 | $39,451 | $122,187 |
| 2016 | $1,701 | $158,470 | $38,678 | $119,792 |
| 2015 | $1,684 | $156,092 | $38,098 | $117,994 |
| 2014 | $1,620 | $153,036 | $37,352 | $115,684 |
Source: Public Records
Map
Nearby Homes
- 158 Eunice Cir
- 161 Eunice Cir
- 266 Shannon St
- 9481 N Broadway
- 821 Cypress Ln
- 251 W Juniper Trail
- 9 Acres N 7th St
- 630 N 6th St
- 1007 N Broadway
- 560 Parker Place
- 0 SW 1 4 of Sec 25 Tp 6 S R 20 E Unit RS26038543
- 0 Blythe Unit 219122850DA
- 0 Blythe Unit 219122849DA
- 0 Blythe Unit PW26026036
- 0 N 4th St
- 521 W Oregon St
- 570 Holley Ln
- 518 N Eucalyptus Ave
- 1159 N Broadway
- 1200 N Broadway
- 270 Eunice Cir
- 231 E Chaparral Dr
- 260 Eunice Cir
- 219 E Chaparral Dr
- 260 E Chaparral Dr
- 256 E Chaparral Dr
- 280 E Chaparral Dr
- 265 Eunice Cir
- 200 Eunice Cir
- 187 E Chaparral Dr
- 218 Eunice Cir
- 290 E Chaparral Dr
- 214 Eunice Cir
- 255 Eunice Cir
- 704 Georgia St
- 204 Eunice Cir
- 177 E Chaparral Dr
- 316 E Chaparral Dr
- 761 Josie St
- 329 Colleen Ct
Your Personal Tour Guide
Ask me questions while you tour the home.