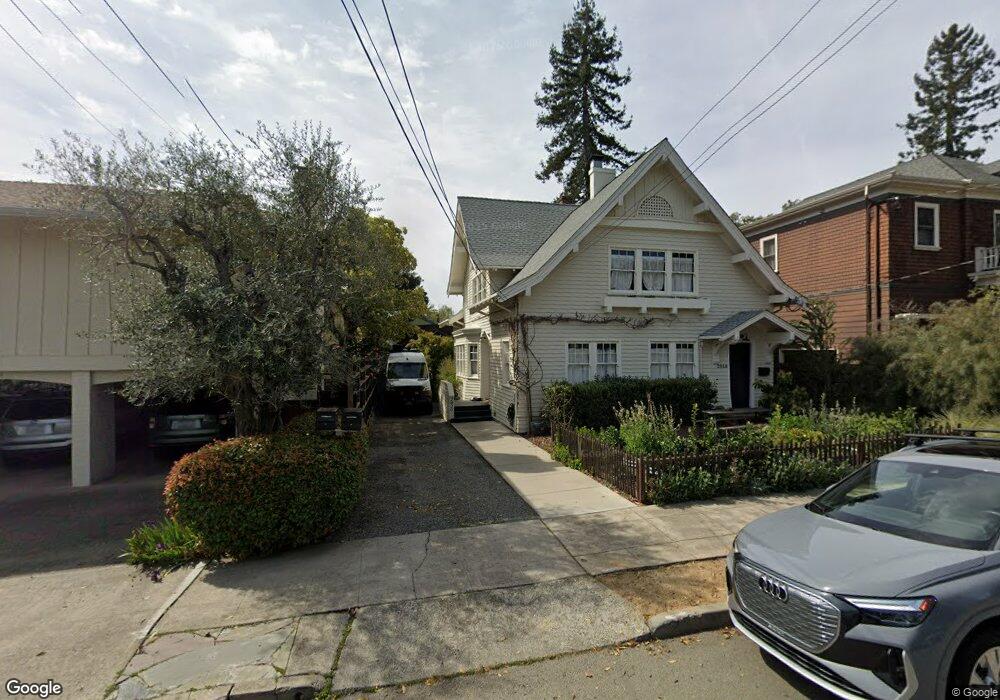
2820 Piedmont Ave Berkeley, CA 94705
Elmwood NeighborhoodEstimated Value: $1,795,000 - $2,628,108
2
Beds
2
Baths
3,338
Sq Ft
$676/Sq Ft
Est. Value
About This Home
This home is located at 2820 Piedmont Ave, Berkeley, CA 94705 and is currently estimated at $2,257,027, approximately $676 per square foot. 2820 Piedmont Ave is a home located in Alameda County with nearby schools including Emerson Elementary School, John Muir Elementary School, and Malcolm X Elementary School.
Ownership History
Date
Name
Owned For
Owner Type
Purchase Details
Closed on
Feb 10, 2022
Sold by
Jamie Kidson
Bought by
Jamie E Kidson Living Trust
Current Estimated Value
Purchase Details
Closed on
Feb 24, 2014
Sold by
Madlener A Fred and Madlener Alicia S
Bought by
Kidson Jamie
Purchase Details
Closed on
Aug 24, 1995
Sold by
Madlener A Fred and Madlener Alicia S
Bought by
Madlener A Fred and Madlener Alicia S
Home Financials for this Owner
Home Financials are based on the most recent Mortgage that was taken out on this home.
Original Mortgage
$96,000
Interest Rate
7.63%
Purchase Details
Closed on
Jul 30, 1994
Sold by
Madlener Fred and Madlener Alison Fred
Bought by
Madlener Fred and Madlener Alison Fred
Create a Home Valuation Report for This Property
The Home Valuation Report is an in-depth analysis detailing your home's value as well as a comparison with similar homes in the area
Home Values in the Area
Average Home Value in this Area
Purchase History
| Date | Buyer | Sale Price | Title Company |
|---|---|---|---|
| Jamie E Kidson Living Trust | -- | Law Office Of Zachary Epstein | |
| Kidson Jamie | $1,360,000 | Placer Title Company | |
| Madlener A Fred | -- | North American Title Co | |
| Madlener Fred | -- | -- |
Source: Public Records
Mortgage History
| Date | Status | Borrower | Loan Amount |
|---|---|---|---|
| Previous Owner | Madlener A Fred | $96,000 |
Source: Public Records
Tax History Compared to Growth
Tax History
| Year | Tax Paid | Tax Assessment Tax Assessment Total Assessment is a certain percentage of the fair market value that is determined by local assessors to be the total taxable value of land and additions on the property. | Land | Improvement |
|---|---|---|---|---|
| 2025 | $29,220 | $1,893,565 | $500,130 | $1,400,435 |
| 2024 | $29,220 | $1,856,308 | $490,326 | $1,372,982 |
| 2023 | $28,531 | $1,826,778 | $480,713 | $1,346,065 |
| 2022 | $28,194 | $1,783,962 | $471,288 | $1,319,674 |
| 2021 | $25,517 | $1,533,171 | $462,051 | $1,078,120 |
| 2020 | $23,255 | $1,524,382 | $457,314 | $1,067,068 |
| 2019 | $22,451 | $1,494,503 | $448,351 | $1,046,152 |
| 2018 | $22,070 | $1,465,208 | $439,562 | $1,025,646 |
| 2017 | $21,333 | $1,436,485 | $430,945 | $1,005,540 |
| 2016 | $20,704 | $1,408,320 | $422,496 | $985,824 |
| 2015 | $20,421 | $1,387,171 | $416,151 | $971,020 |
| 2014 | $4,558 | $86,003 | $62,602 | $23,401 |
Source: Public Records
Map
Nearby Homes
- 2964 Magnolia St
- 2610 Piedmont Ave
- 2732 Parker St
- 2670 Parker St
- 2601 College Ave Unit 203
- 2601 College Ave Unit 208
- 2644 Parker St
- 2587 Piedmont Ave Unit 3
- 3021 Bateman St
- 2417 Webster St
- 7361 Claremont Ave
- 6446 Colby St
- 2636 Alcatraz Ave
- 2420 Hillside Ave
- 6218 Manoa St
- 2409 College Ave
- 2509 Dwight Way
- 309 63rd St
- 3047 Halcyon Ct
- 2907 Channing Way
- 2818 Piedmont Ave
- 2814 Piedmont Ave
- 2812 Piedmont Ave
- 2824 Piedmont Ave Unit 1
- 2822 Piedmont Ave
- 2828 Piedmont Ave Unit 3
- 2826 Piedmont Ave
- 2810 Piedmont Ave
- 2817 Cherry St
- 2821 Cherry St
- 2815 Cherry St
- 2804 Piedmont Ave
- 2733 Russell St Unit A
- 2733 Russell St
- 2737 Russell St
- 2811 Cherry St
- 2832 Piedmont Ave
- 2823 Cherry St
- 2827 Cherry St
- 2819 Piedmont Ave