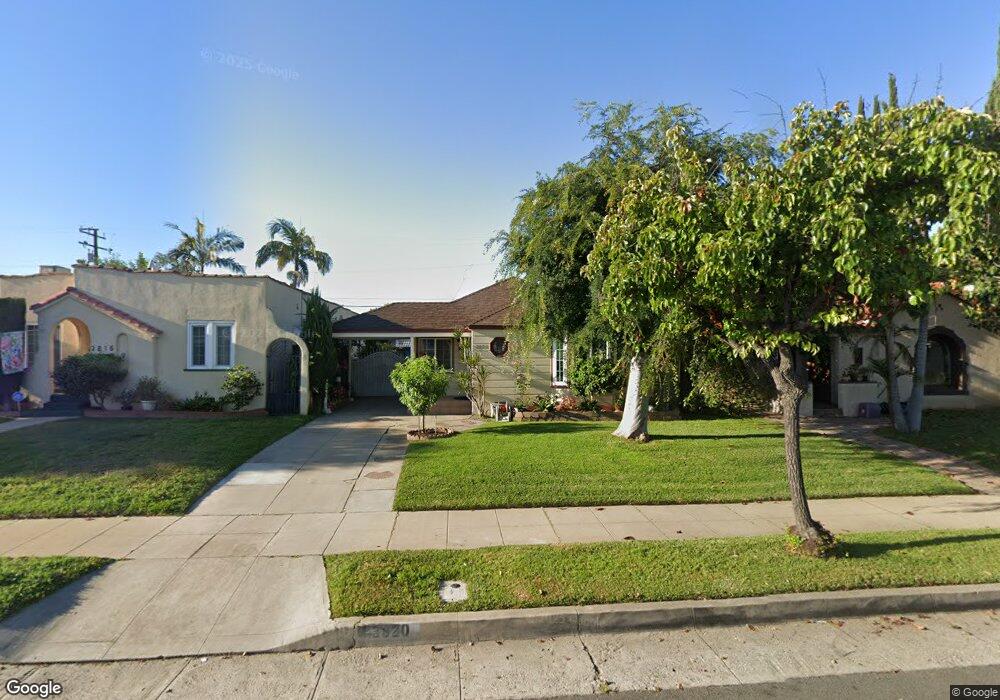
2820 W Shorb St Alhambra, CA 91803
Alhambra Hills NeighborhoodEstimated Value: $795,000 - $919,000
2
Beds
1
Bath
1,154
Sq Ft
$730/Sq Ft
Est. Value
About This Home
This home is located at 2820 W Shorb St, Alhambra, CA 91803 and is currently estimated at $842,882, approximately $730 per square foot. 2820 W Shorb St is a home located in Los Angeles County with nearby schools including Fremont Elementary School, Alhambra High School, and St. Thomas More Catholic Elementary School.
Ownership History
Date
Name
Owned For
Owner Type
Purchase Details
Closed on
Mar 8, 2018
Sold by
Chan Fookling
Bought by
Chan Fookling and Wong Kuang Y
Current Estimated Value
Purchase Details
Closed on
Jul 11, 2015
Sold by
Chan Fookling
Bought by
Chan Fookling and Huang Minyi
Purchase Details
Closed on
Apr 7, 2010
Sold by
The Bank Of New York Mellon
Bought by
Chan Fookling and Huang Minyi
Purchase Details
Closed on
Jan 5, 2010
Sold by
Kobayashi Byron J and Kobayashi Victoria G
Bought by
The Bank Of New York Mellon and The Bank Of New York
Purchase Details
Closed on
Sep 26, 2005
Sold by
Desilva Erlinda and Jose R Hernandez Revocable Tru
Bought by
Kobayashi Byron J
Home Financials for this Owner
Home Financials are based on the most recent Mortgage that was taken out on this home.
Original Mortgage
$348,750
Interest Rate
6.87%
Mortgage Type
Purchase Money Mortgage
Purchase Details
Closed on
Oct 1, 2003
Sold by
Hernandez Jose R
Bought by
Hernandez Jose R
Create a Home Valuation Report for This Property
The Home Valuation Report is an in-depth analysis detailing your home's value as well as a comparison with similar homes in the area
Home Values in the Area
Average Home Value in this Area
Purchase History
| Date | Buyer | Sale Price | Title Company |
|---|---|---|---|
| Chan Fookling | $109,500 | None Available | |
| Huang Minyi | -- | None Available | |
| Chan Fookling | -- | None Available | |
| Chan Fookling | $341,000 | Lsi Title Agency | |
| Chan Fookling | -- | Lsi Title Agency | |
| The Bank Of New York Mellon | $402,132 | Accommodation | |
| Kobayashi Byron J | $465,000 | Southland Title | |
| Hernandez Jose R | -- | -- |
Source: Public Records
Mortgage History
| Date | Status | Borrower | Loan Amount |
|---|---|---|---|
| Previous Owner | Kobayashi Byron J | $348,750 |
Source: Public Records
Tax History Compared to Growth
Tax History
| Year | Tax Paid | Tax Assessment Tax Assessment Total Assessment is a certain percentage of the fair market value that is determined by local assessors to be the total taxable value of land and additions on the property. | Land | Improvement |
|---|---|---|---|---|
| 2025 | $5,420 | $440,160 | $352,132 | $88,028 |
| 2024 | $5,420 | $431,530 | $345,228 | $86,302 |
| 2023 | $5,373 | $423,069 | $338,459 | $84,610 |
| 2022 | $5,117 | $414,774 | $331,823 | $82,951 |
| 2021 | $5,062 | $406,642 | $325,317 | $81,325 |
| 2019 | $4,884 | $394,583 | $315,669 | $78,914 |
| 2018 | $4,867 | $386,847 | $309,480 | $77,367 |
| 2016 | $4,475 | $371,826 | $297,463 | $74,363 |
| 2015 | $4,406 | $366,241 | $292,995 | $73,246 |
| 2014 | -- | $359,068 | $287,256 | $71,812 |
Source: Public Records
Map
Nearby Homes
- 2901 Front St
- 1417 Milton Ave
- 1705 S Fremont Ave
- 3008 Parkview Dr
- 1343 Edgewood Dr
- 1342 Edgewood Dr
- 1005 Westmont Dr
- 2334 Highbury Ave
- 1300 S Date Ave
- 1903 S Primrose Ave
- 2000 La Paloma Ave
- 2917 W Hellman Ave
- 2325 Highbury Ave Unit 59
- 2912 W Hellman Ave
- 2273 Highbury Ave
- 3123 Stockbridge Ave
- 2912 Covina St
- 1937 Charnwood Ave
- 3211 Stockbridge Ave
- 657 S Meridian Ave
- 2816 W Shorb St
- 2812 W Shorb St
- 2904 W Shorb St
- 2833 W Valley Blvd
- 2808 W Shorb St
- 2908 W Shorb St
- 2821 W Valley Blvd
- 2804 W Shorb St
- 2912 W Shorb St
- 2821 W Shorb St
- 2817 W Shorb St
- 2901 W Shorb St
- 2815 W Shorb St
- 2905 W Shorb St
- 2801 W Valley Blvd
- 2916 W Shorb St
- 2800 W Shorb St
- 2809 W Shorb St
- 2909 W Shorb St
- 2805 W Shorb St