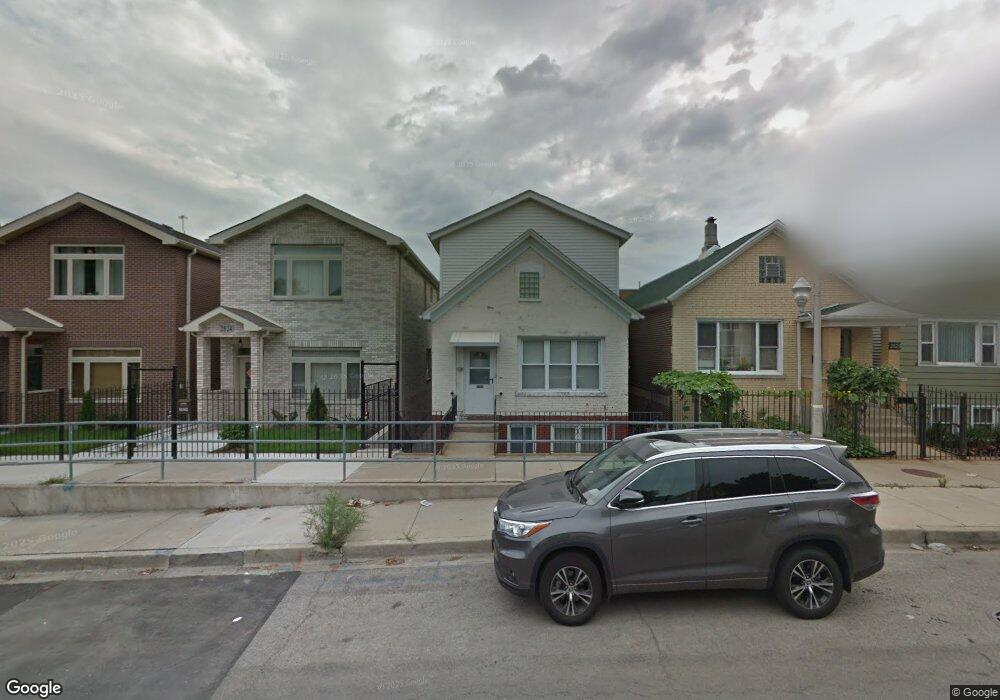
2822 S Loomis St Chicago, IL 60608
Bridgeport NeighborhoodEstimated Value: $362,000 - $577,000
4
Beds
6
Baths
1,311
Sq Ft
$334/Sq Ft
Est. Value
About This Home
This home is located at 2822 S Loomis St, Chicago, IL 60608 and is currently estimated at $437,643, approximately $333 per square foot. 2822 S Loomis St is a home located in Cook County with nearby schools including Holden Elementary School, St Therese School West, and St Barbara Elementary School.
Ownership History
Date
Name
Owned For
Owner Type
Purchase Details
Closed on
Nov 30, 2017
Sold by
Zhou Weihong and Zhou Jianzhong
Bought by
Torres Juan Mora
Current Estimated Value
Home Financials for this Owner
Home Financials are based on the most recent Mortgage that was taken out on this home.
Original Mortgage
$242,500
Outstanding Balance
$205,777
Interest Rate
4.25%
Mortgage Type
New Conventional
Estimated Equity
$231,866
Purchase Details
Closed on
Oct 19, 2009
Sold by
Abbott Elizabeth M and Begley Elizabeth M
Bought by
Zhou Weihong and Zhou Jianzhong
Home Financials for this Owner
Home Financials are based on the most recent Mortgage that was taken out on this home.
Original Mortgage
$80,000
Interest Rate
6.95%
Mortgage Type
New Conventional
Purchase Details
Closed on
Nov 2, 1999
Sold by
Jarski Bruno E and Jarski Edward
Bought by
Abbott Elizabeth M and Begley Wayne E
Home Financials for this Owner
Home Financials are based on the most recent Mortgage that was taken out on this home.
Original Mortgage
$68,000
Interest Rate
7.78%
Create a Home Valuation Report for This Property
The Home Valuation Report is an in-depth analysis detailing your home's value as well as a comparison with similar homes in the area
Home Values in the Area
Average Home Value in this Area
Purchase History
| Date | Buyer | Sale Price | Title Company |
|---|---|---|---|
| Torres Juan Mora | $250,000 | First American Title | |
| Zhou Weihong | $175,000 | Pntn | |
| Abbott Elizabeth M | $75,000 | -- |
Source: Public Records
Mortgage History
| Date | Status | Borrower | Loan Amount |
|---|---|---|---|
| Open | Torres Juan Mora | $242,500 | |
| Previous Owner | Zhou Weihong | $80,000 | |
| Previous Owner | Abbott Elizabeth M | $68,000 |
Source: Public Records
Tax History Compared to Growth
Tax History
| Year | Tax Paid | Tax Assessment Tax Assessment Total Assessment is a certain percentage of the fair market value that is determined by local assessors to be the total taxable value of land and additions on the property. | Land | Improvement |
|---|---|---|---|---|
| 2024 | $4,390 | $32,000 | $13,424 | $18,576 |
| 2023 | $4,240 | $26,773 | $10,848 | $15,925 |
| 2022 | $4,240 | $26,773 | $10,848 | $15,925 |
| 2021 | $4,178 | $26,773 | $10,848 | $15,925 |
| 2020 | $4,819 | $21,634 | $8,678 | $12,956 |
| 2019 | $4,830 | $24,038 | $8,678 | $15,360 |
| 2018 | $4,748 | $24,038 | $8,678 | $15,360 |
| 2017 | $3,472 | $19,503 | $6,780 | $12,723 |
| 2016 | $3,406 | $19,503 | $6,780 | $12,723 |
| 2015 | $3,093 | $19,503 | $6,780 | $12,723 |
| 2014 | $2,523 | $16,164 | $5,424 | $10,740 |
| 2013 | $2,462 | $16,164 | $5,424 | $10,740 |
Source: Public Records
Map
Nearby Homes
- 2859 S Hillock Ave
- 2713 S Crowell St
- 2903 S Hillock Ave
- 2833 S Broad St
- 2837 S Farrell St
- 3456 S Archer Ave
- 2948 S Lyman St
- 2520 S Stark St
- 2725 S Quinn St
- 1312 W 31st St
- 2922 S Keeley St
- 2879 S Throop St
- 2819 S Quinn St
- 2517 S Mary St
- 1226 W 31st Place
- 2947 S Farrell St
- 2951 S Farrell St
- 2935 S Throop St
- 4936 S Loomis St
- 2812 S Quinn St
- 2824 S Loomis St
- 2820 S Loomis St
- 2826 S Loomis St
- 2818 S Loomis St
- 2830 S Loomis St
- 2832 S Loomis St
- 2812 S Loomis St
- 2812 S Thomas Barclay Dr
- 2823 S Loomis St
- 2813 S Thomas Barclay Dr
- 2816 S Thomas Barclay Dr
- 2831 S Loomis St
- 2831 S Loomis St
- 2815 S Thomas Barclay Dr
- 2827 S Loomis St
- 2818 S Thomas Barclay Dr
- 2819 S Loomis St
- 2829 S Loomis St
- 2815 S Loomis St
- 2803 S Hillock Ave