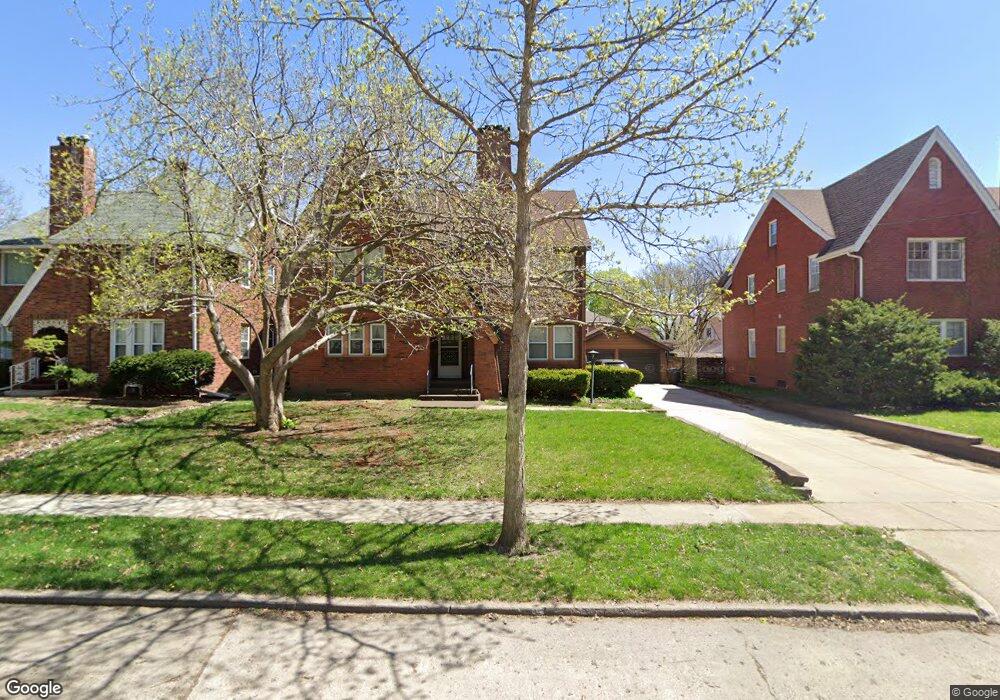
2823 43rd St Des Moines, IA 50310
Beaverdale NeighborhoodEstimated Value: $311,302 - $351,000
4
Beds
3
Baths
2,616
Sq Ft
$127/Sq Ft
Est. Value
About This Home
This home is located at 2823 43rd St, Des Moines, IA 50310 and is currently estimated at $331,151, approximately $126 per square foot. 2823 43rd St is a home located in Polk County with nearby schools including Hillis Elementary School, Meredith Middle School, and Hoover High School.
Ownership History
Date
Name
Owned For
Owner Type
Purchase Details
Closed on
Feb 13, 1998
Sold by
Johnson Denise L and Johnson Richard
Bought by
Hartline Nile
Current Estimated Value
Home Financials for this Owner
Home Financials are based on the most recent Mortgage that was taken out on this home.
Original Mortgage
$89,600
Outstanding Balance
$16,031
Interest Rate
7.12%
Mortgage Type
Commercial
Estimated Equity
$315,120
Purchase Details
Closed on
Feb 9, 1998
Sold by
Patterson James E and Patterson Linda L
Bought by
Hartline Nile
Home Financials for this Owner
Home Financials are based on the most recent Mortgage that was taken out on this home.
Original Mortgage
$89,600
Outstanding Balance
$16,031
Interest Rate
7.12%
Mortgage Type
Commercial
Estimated Equity
$315,120
Create a Home Valuation Report for This Property
The Home Valuation Report is an in-depth analysis detailing your home's value as well as a comparison with similar homes in the area
Home Values in the Area
Average Home Value in this Area
Purchase History
| Date | Buyer | Sale Price | Title Company |
|---|---|---|---|
| Hartline Nile | $111,500 | -- | |
| Hartline Nile | -- | -- | |
| Hartline Nile | -- | -- |
Source: Public Records
Mortgage History
| Date | Status | Borrower | Loan Amount |
|---|---|---|---|
| Open | Hartline Nile | $89,600 |
Source: Public Records
Tax History Compared to Growth
Tax History
| Year | Tax Paid | Tax Assessment Tax Assessment Total Assessment is a certain percentage of the fair market value that is determined by local assessors to be the total taxable value of land and additions on the property. | Land | Improvement |
|---|---|---|---|---|
| 2025 | $5,576 | $291,000 | $42,300 | $248,700 |
| 2024 | $5,576 | $283,400 | $38,000 | $245,400 |
| 2023 | $5,808 | $283,400 | $38,000 | $245,400 |
| 2022 | $5,762 | $246,400 | $33,600 | $212,800 |
| 2021 | $5,582 | $246,400 | $33,600 | $212,800 |
| 2020 | $5,800 | $223,700 | $30,800 | $192,900 |
| 2019 | $5,788 | $223,700 | $30,800 | $192,900 |
| 2018 | $5,730 | $215,400 | $27,400 | $188,000 |
| 2017 | $5,202 | $215,400 | $27,400 | $188,000 |
| 2016 | $5,068 | $192,300 | $24,000 | $168,300 |
| 2015 | $5,068 | $192,300 | $24,000 | $168,300 |
| 2014 | $4,860 | $182,900 | $22,300 | $160,600 |
Source: Public Records
Map
Nearby Homes
- 2817 43rd St
- 2827 43rd St
- 4236 Urbandale Ave
- 2813 43rd St
- 4232 Urbandale Ave
- 2809 43rd St
- 2820 43rd St
- 2846 43rd St
- 4300 Urbandale Ave
- 2818 43rd St
- 2816 42nd St
- 2814 42nd St
- 2812 43rd St
- 2805 43rd St
- 4310 Urbandale Ave
- 2808 43rd St
- 4221 Urbandale Ave
- 4227 Urbandale Ave
- 2804 42nd St
- 4215 Urbandale Ave