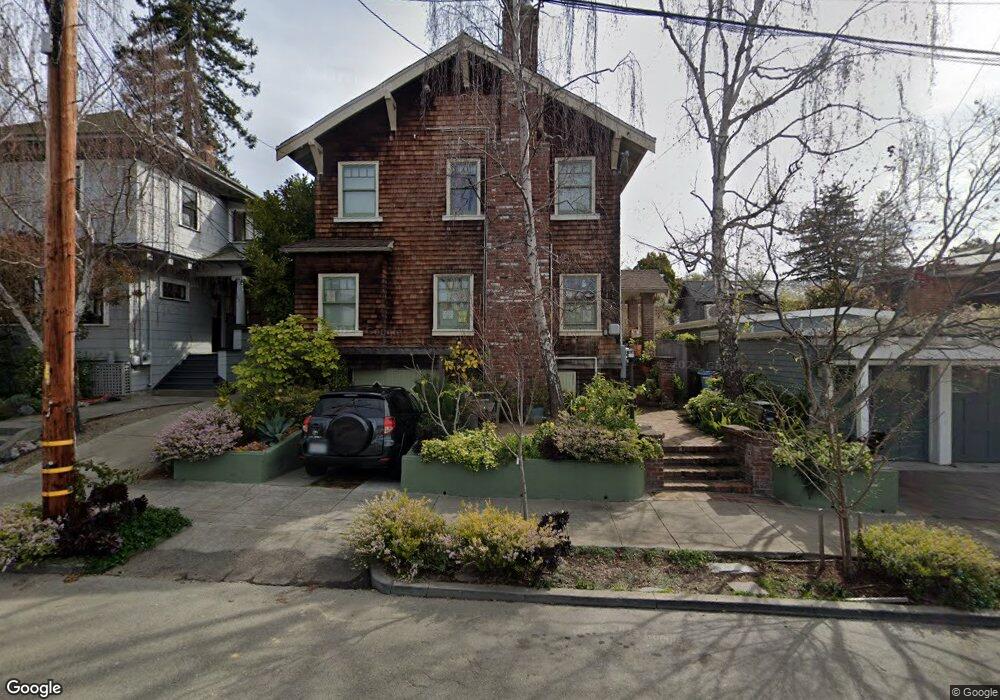
2823 Cherry St Berkeley, CA 94705
Elmwood NeighborhoodEstimated Value: $2,630,000 - $2,929,000
4
Beds
3
Baths
2,428
Sq Ft
$1,139/Sq Ft
Est. Value
About This Home
This home is located at 2823 Cherry St, Berkeley, CA 94705 and is currently estimated at $2,766,382, approximately $1,139 per square foot. 2823 Cherry St is a home located in Alameda County with nearby schools including Emerson Elementary School, John Muir Elementary School, and Malcolm X Elementary School.
Ownership History
Date
Name
Owned For
Owner Type
Purchase Details
Closed on
Aug 16, 2024
Sold by
Darling Nathan and Darling Alexandra Blair
Bought by
Darling And Darling Revocable Trust and Darling
Current Estimated Value
Purchase Details
Closed on
Sep 25, 2018
Sold by
Murray Douglas and Glenn Bernadette
Bought by
Blair Alexandra and Alexandra T L Blair Living Tru
Purchase Details
Closed on
Jan 26, 2015
Sold by
Murray Douglas S and Glenn Murray Bernadette
Bought by
Douglas Murray and Douglas Bernadette Glenn
Create a Home Valuation Report for This Property
The Home Valuation Report is an in-depth analysis detailing your home's value as well as a comparison with similar homes in the area
Home Values in the Area
Average Home Value in this Area
Purchase History
| Date | Buyer | Sale Price | Title Company |
|---|---|---|---|
| Darling And Darling Revocable Trust | -- | None Listed On Document | |
| Darling Nathan | -- | None Listed On Document | |
| Blair Alexandra | $2,275,000 | Chicago Title Company | |
| Douglas Murray | -- | None Available |
Source: Public Records
Tax History
| Year | Tax Paid | Tax Assessment Tax Assessment Total Assessment is a certain percentage of the fair market value that is determined by local assessors to be the total taxable value of land and additions on the property. | Land | Improvement |
|---|---|---|---|---|
| 2025 | $36,382 | $2,593,464 | $761,328 | $1,832,136 |
| 2024 | $36,382 | $2,542,618 | $746,402 | $1,796,216 |
| 2023 | $35,618 | $2,492,772 | $731,769 | $1,761,003 |
| 2022 | $35,017 | $2,443,902 | $717,423 | $1,726,479 |
| 2021 | $34,815 | $2,344,985 | $703,357 | $1,641,628 |
| 2020 | $32,460 | $2,320,500 | $696,150 | $1,624,350 |
| 2019 | $31,483 | $2,275,000 | $682,500 | $1,592,500 |
| 2018 | $12,230 | $708,473 | $212,542 | $495,931 |
| 2017 | $11,786 | $694,584 | $208,375 | $486,209 |
| 2016 | $11,332 | $680,968 | $204,290 | $476,678 |
| 2015 | $11,163 | $670,743 | $201,223 | $469,520 |
| 2014 | $11,223 | $657,607 | $197,282 | $460,325 |
Source: Public Records
Map
Nearby Homes
- 2817 Palm Ct
- 2643 Stuart St
- 2962 Piedmont Ave
- 2632 Warring St Unit 3
- 2601 College Ave Unit 203
- 2601 College Ave Unit 208
- 2935 Florence St
- 2477 Prince St
- 2917 Telegraph Ave
- 2702 Dana St
- 2535 Chilton Way
- 2319 Ward St
- 190 Stonewall Rd
- 2509 Dwight Way
- 6446 Colby St
- 2550 Dana St Unit 2F
- 2243 Ashby Ave
- 360 Alcatraz Ave
- 2 Panoramic Way Unit 105
- 2 Panoramic Way Unit 304
- 2821 Cherry St
- 2827 Cherry St
- 2817 Cherry St
- 2727 Russell St
- 2815 Cherry St
- 2733 Russell St Unit B
- 2733 Russell St Unit A
- 2733 Russell St
- 2828 Cherry St
- 2824 Cherry St
- 2830 Cherry St
- 2811 Cherry St
- 2832 Cherry St
- 2824 Piedmont Ave Unit 1
- 2822 Piedmont Ave
- 2828 Piedmont Ave Unit 3
- 2826 Piedmont Ave
- 2820 Piedmont Ave
- 2820 Cherry St Unit 2820
- 2818 Cherry St Unit 2818
Your Personal Tour Guide
Ask me questions while you tour the home.