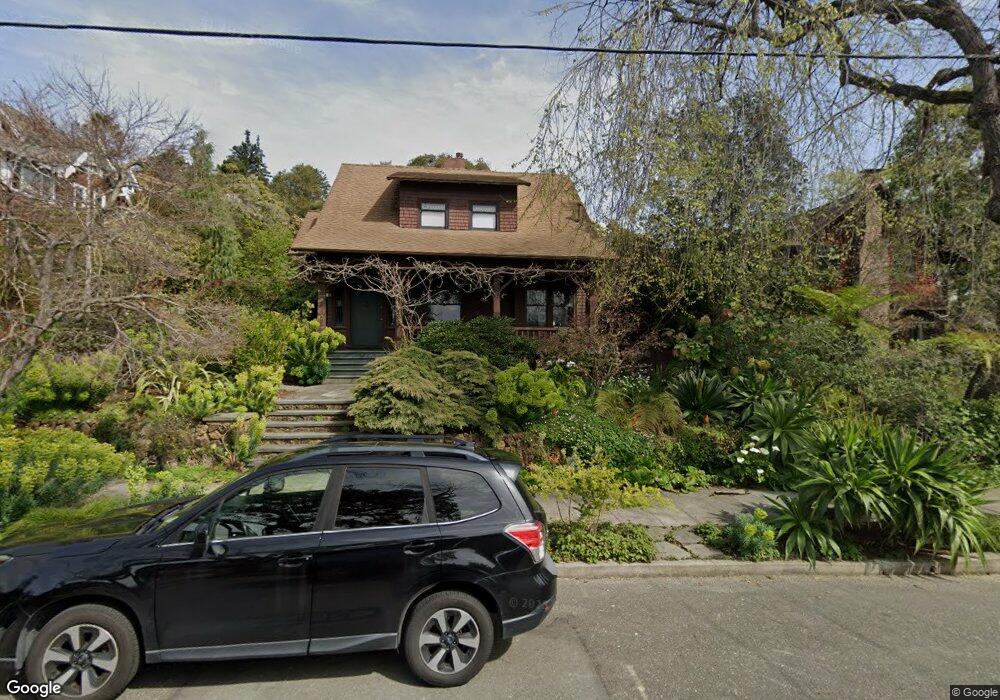
2823 Kelsey St Berkeley, CA 94705
Claremont NeighborhoodEstimated Value: $2,566,233 - $3,043,000
3
Beds
3
Baths
2,699
Sq Ft
$1,027/Sq Ft
Est. Value
About This Home
This home is located at 2823 Kelsey St, Berkeley, CA 94705 and is currently estimated at $2,770,558, approximately $1,026 per square foot. 2823 Kelsey St is a home located in Alameda County with nearby schools including John Muir Elementary School, Emerson Elementary School, and Malcolm X Elementary School.
Ownership History
Date
Name
Owned For
Owner Type
Purchase Details
Closed on
Apr 10, 2008
Sold by
Redding Jonathan W and Burgess Diane G
Bought by
Redding Jonathan W and Burgess Diane G
Current Estimated Value
Purchase Details
Closed on
May 10, 1994
Sold by
Mueller Martin and Dixon Mueller Ruth
Bought by
Redding Jonathan Wayne and Burgess Diane Gail
Home Financials for this Owner
Home Financials are based on the most recent Mortgage that was taken out on this home.
Original Mortgage
$408,800
Interest Rate
4.62%
Create a Home Valuation Report for This Property
The Home Valuation Report is an in-depth analysis detailing your home's value as well as a comparison with similar homes in the area
Home Values in the Area
Average Home Value in this Area
Purchase History
| Date | Buyer | Sale Price | Title Company |
|---|---|---|---|
| Redding Jonathan W | -- | None Available | |
| Redding Jonathan Wayne | $511,000 | Placer Title Company |
Source: Public Records
Mortgage History
| Date | Status | Borrower | Loan Amount |
|---|---|---|---|
| Closed | Redding Jonathan Wayne | $408,800 |
Source: Public Records
Tax History
| Year | Tax Paid | Tax Assessment Tax Assessment Total Assessment is a certain percentage of the fair market value that is determined by local assessors to be the total taxable value of land and additions on the property. | Land | Improvement |
|---|---|---|---|---|
| 2025 | $16,048 | $807,790 | $209,560 | $605,230 |
| 2024 | $16,048 | $791,817 | $205,452 | $593,365 |
| 2023 | $15,623 | $783,155 | $201,424 | $581,731 |
| 2022 | $15,205 | $760,799 | $197,474 | $570,325 |
| 2021 | $15,194 | $745,747 | $193,603 | $559,144 |
| 2020 | $14,198 | $745,029 | $191,618 | $553,411 |
| 2019 | $13,439 | $730,422 | $187,861 | $542,561 |
| 2018 | $13,156 | $716,102 | $184,178 | $531,924 |
| 2017 | $12,692 | $702,064 | $180,567 | $521,497 |
| 2016 | $12,143 | $688,301 | $177,027 | $511,274 |
| 2015 | $11,950 | $677,965 | $174,369 | $503,596 |
| 2014 | $11,751 | $664,686 | $170,954 | $493,732 |
Source: Public Records
Map
Nearby Homes
- 2817 Palm Ct
- 2643 Stuart St
- 2962 Piedmont Ave
- 2632 Warring St Unit 3
- 2601 College Ave Unit 203
- 2601 College Ave Unit 208
- 190 Stonewall Rd
- 2935 Florence St
- 2477 Prince St
- 2917 Telegraph Ave
- 2702 Dana St
- 641 Alvarado Rd
- 2535 Chilton Way
- 6446 Colby St
- 2509 Dwight Way
- 2 Gravatt Dr
- 0 Gravatt Dr Unit 41122154
- 2319 Ward St
- 1488 Alvarado Rd
- 360 Alcatraz Ave
- 2815 Kelsey St
- 2827 Kelsey St
- 2813 Kelsey St
- 2811 Kelsey St
- 2910 Avalon Ave
- 2916 Avalon Ave
- 2814 Kelsey St
- 2827 Russell St
- 2829 Russell St
- 2810 Kelsey St
- 2839 Russell St
- 2818 Kelsey St
- 2806 Kelsey St
- 2904 Avalon Ave
- 2824 Kelsey St
- 2804 Kelsey St
- 2820 Kelsey St
- 2826 Kelsey St
- 2841 Russell St
- 2800 Kelsey St
Your Personal Tour Guide
Ask me questions while you tour the home.