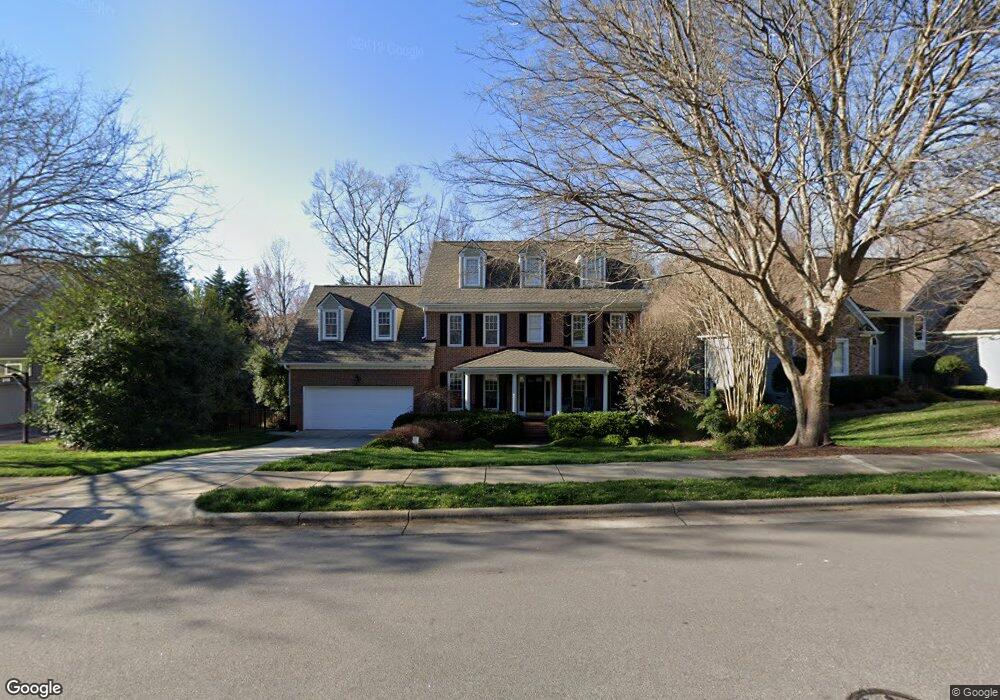
2823 Stone Gap Ct Raleigh, NC 27612
Crabtree NeighborhoodEstimated Value: $808,000 - $900,000
4
Beds
4
Baths
2,991
Sq Ft
$290/Sq Ft
Est. Value
About This Home
This home is located at 2823 Stone Gap Ct, Raleigh, NC 27612 and is currently estimated at $866,255, approximately $289 per square foot. 2823 Stone Gap Ct is a home located in Wake County with nearby schools including Stough Elementary School, Oberlin Middle School, and Broughton Magnet High School.
Ownership History
Date
Name
Owned For
Owner Type
Purchase Details
Closed on
Apr 21, 2020
Sold by
Newman Jonathan Chad and Newman Kimberly V
Bought by
West Michael and West Jennifer
Current Estimated Value
Home Financials for this Owner
Home Financials are based on the most recent Mortgage that was taken out on this home.
Original Mortgage
$494,000
Outstanding Balance
$436,793
Interest Rate
3.3%
Mortgage Type
New Conventional
Estimated Equity
$429,462
Purchase Details
Closed on
May 31, 2016
Sold by
Hibbert Susan E and Hibbert Carl W
Bought by
Newman Jonathan Chad and Newman Kimberly
Home Financials for this Owner
Home Financials are based on the most recent Mortgage that was taken out on this home.
Original Mortgage
$405,000
Interest Rate
3.58%
Mortgage Type
New Conventional
Purchase Details
Closed on
Apr 20, 1999
Sold by
James C Fields Construction Co Inc
Bought by
Roberts Susan E
Create a Home Valuation Report for This Property
The Home Valuation Report is an in-depth analysis detailing your home's value as well as a comparison with similar homes in the area
Home Values in the Area
Average Home Value in this Area
Purchase History
| Date | Buyer | Sale Price | Title Company |
|---|---|---|---|
| West Michael | $520,000 | None Available | |
| West Michael | -- | None Listed On Document | |
| Newman Jonathan Chad | $450,000 | None Available | |
| Roberts Susan E | $305,000 | -- |
Source: Public Records
Mortgage History
| Date | Status | Borrower | Loan Amount |
|---|---|---|---|
| Open | West Michael | $494,000 | |
| Closed | West Michael | $494,000 | |
| Previous Owner | Newman Jonathan Chad | $405,000 |
Source: Public Records
Tax History
| Year | Tax Paid | Tax Assessment Tax Assessment Total Assessment is a certain percentage of the fair market value that is determined by local assessors to be the total taxable value of land and additions on the property. | Land | Improvement |
|---|---|---|---|---|
| 2025 | $6,959 | $795,624 | $225,000 | $570,624 |
| 2024 | $6,930 | $795,624 | $225,000 | $570,624 |
| 2023 | $5,670 | $518,341 | $120,000 | $398,341 |
| 2022 | $5,268 | $518,341 | $120,000 | $398,341 |
| 2021 | $5,063 | $518,341 | $120,000 | $398,341 |
| 2020 | $4,971 | $518,341 | $120,000 | $398,341 |
| 2019 | $5,274 | $453,398 | $120,000 | $333,398 |
| 2018 | $4,974 | $453,398 | $120,000 | $333,398 |
| 2017 | $4,737 | $453,398 | $120,000 | $333,398 |
| 2016 | $4,639 | $453,398 | $120,000 | $333,398 |
| 2015 | $4,999 | $480,866 | $140,000 | $340,866 |
| 2014 | $4,741 | $480,866 | $140,000 | $340,866 |
Source: Public Records
Map
Nearby Homes
- 3634 Mill Run Unit 20
- 3559 Mill Run Unit 45
- 3401 Mill Run
- 3237 Mill Run Unit 183
- 3425 Sir Colleton Ct
- 3607 Baron Monck Pass
- 5309 Richland Dr
- 3701 Baron Cooper Pass Unit 104
- 3700 Baron Cooper Pass Unit 105
- 3700 Baron Cooper Pass Unit 204
- 3912 Stags Leap Cir Unit 27
- 3812 City of Oaks Wynd
- 3161 Hemlock Forest Cir Unit 101
- 3912 City of Oaks Wynd
- 4016 Edward Pride Wynd
- 3121 Hemlock Forest Cir Unit 203
- 3929 Bentley Brook Dr
- 3917 Bentley Brook Dr
- 2831 Edridge Ct Unit 202
- 4120 Sedgewood Dr Unit 201
- 2819 Stone Gap Ct
- 2901 Stone Gap Ct
- 3315 Doe Hill Ct
- 4605 Grenadine Ct
- 4601 Grenadine Ct
- 2815 Stone Gap Ct
- 4609 Grenadine Ct
- 3115 Doe Hill Ct
- 2905 Stone Gap Ct
- 3112 Doe Hill Ct
- 2816 Stone Gap Ct
- 4600 Grenadine Ct
- 2809 Stone Gap Ct
- 4613 Grenadine Ct
- 2812 Stone Gap Ct
- 3108 Doe Hill Ct
- 4608 Grenadine Ct
- 3131 Briar Stream Run
- 4604 Grenadine Ct
- 4617 Grenadine Ct
Your Personal Tour Guide
Ask me questions while you tour the home.