Estimated Value: $378,000 - $463,000
2
Beds
1
Bath
1,019
Sq Ft
$406/Sq Ft
Est. Value
About This Home
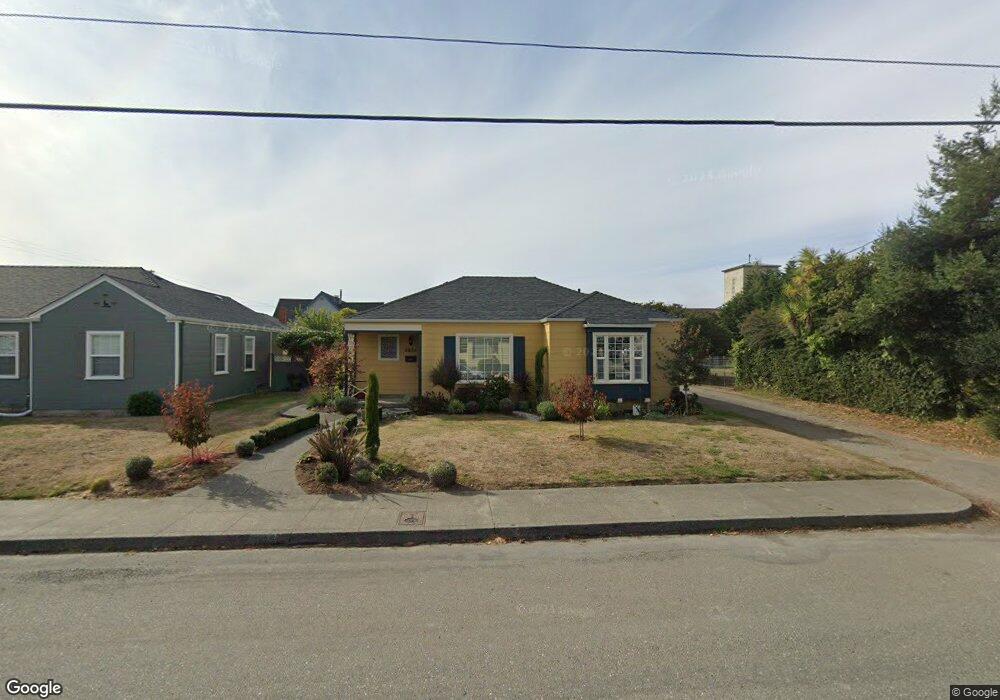
This home is located at 2826 L St, Eureka, CA 95501 and is currently estimated at $413,676, approximately $405 per square foot. 2826 L St is a home located in Humboldt County with nearby schools including Washington Elementary School, Catherine L. Zane Middle School, and Eureka Senior High School.
Ownership History
Date
Name
Owned For
Owner Type
Purchase Details
Closed on
Dec 12, 2016
Sold by
Bette L Vallee 1992 Revocable Trust
Bought by
Vallee Paul
Current Estimated Value
Home Financials for this Owner
Home Financials are based on the most recent Mortgage that was taken out on this home.
Original Mortgage
$242,250
Outstanding Balance
$194,700
Interest Rate
3.54%
Mortgage Type
New Conventional
Estimated Equity
$218,976
Purchase Details
Closed on
Nov 15, 2007
Sold by
Vallee Bette A
Bought by
Vallee Bette L and Bette L Vallee 1992 Revocable
Purchase Details
Closed on
Feb 2, 2006
Sold by
Sanders Alton J and Sanders Patricia
Bought by
Vallee Bette A
Home Financials for this Owner
Home Financials are based on the most recent Mortgage that was taken out on this home.
Original Mortgage
$125,000
Interest Rate
6.25%
Mortgage Type
Fannie Mae Freddie Mac
Create a Home Valuation Report for This Property
The Home Valuation Report is an in-depth analysis detailing your home's value as well as a comparison with similar homes in the area
Home Values in the Area
Average Home Value in this Area
Purchase History
| Date | Buyer | Sale Price | Title Company |
|---|---|---|---|
| Vallee Paul | $255,000 | Fidelity Natl Title Co Of Ca | |
| Vallee Bette L | -- | None Available | |
| Vallee Bette A | $295,000 | First American Title Co |
Source: Public Records
Mortgage History
| Date | Status | Borrower | Loan Amount |
|---|---|---|---|
| Open | Vallee Paul | $242,250 | |
| Previous Owner | Vallee Bette A | $125,000 |
Source: Public Records
Tax History
| Year | Tax Paid | Tax Assessment Tax Assessment Total Assessment is a certain percentage of the fair market value that is determined by local assessors to be the total taxable value of land and additions on the property. | Land | Improvement |
|---|---|---|---|---|
| 2025 | $4,072 | $403,123 | $136,646 | $266,477 |
| 2024 | $4,072 | $395,219 | $133,967 | $261,252 |
| 2023 | $2,880 | $280,000 | $110,000 | $170,000 |
| 2022 | $3,049 | $280,000 | $110,000 | $170,000 |
| 2021 | $2,913 | $280,000 | $110,000 | $170,000 |
| 2020 | $2,921 | $280,000 | $110,000 | $170,000 |
| 2019 | $2,918 | $225,000 | $100,000 | $125,000 |
| 2018 | $2,341 | $225,000 | $100,000 | $125,000 |
| 2017 | $2,376 | $225,000 | $100,000 | $125,000 |
| 2016 | $2,424 | $225,000 | $100,000 | $125,000 |
| 2015 | $2,439 | $225,000 | $100,000 | $125,000 |
| 2014 | $2,326 | $225,000 | $100,000 | $125,000 |
Source: Public Records
Map
Nearby Homes
Your Personal Tour Guide
Ask me questions while you tour the home.