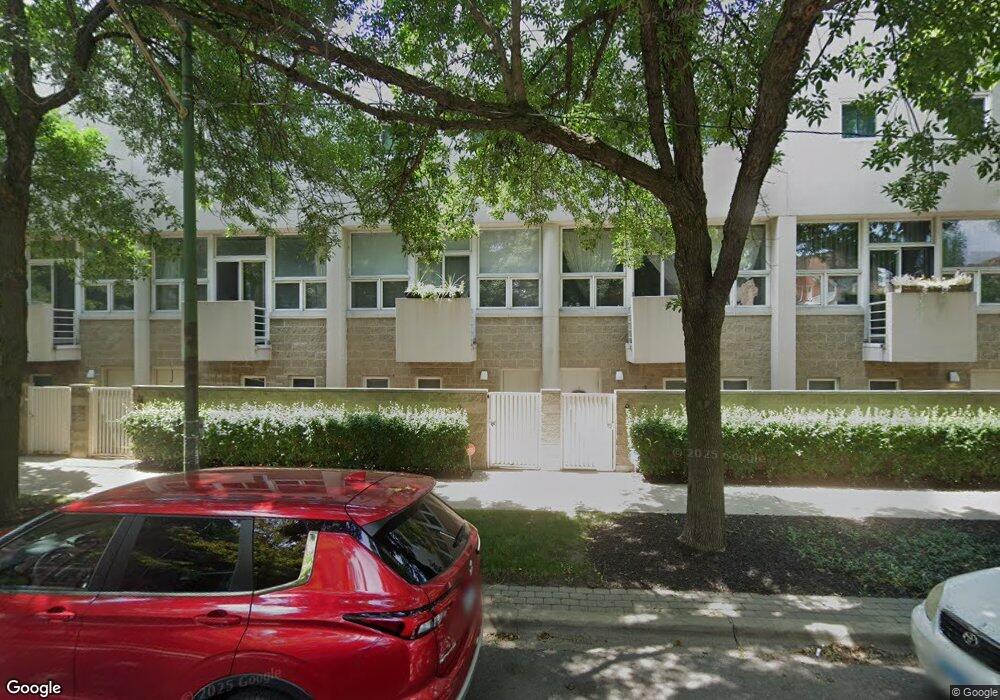
2826 N Talman Ave Chicago, IL 60618
Avondale NeighborhoodEstimated Value: $697,000 - $874,000
3
Beds
2
Baths
2,424
Sq Ft
$321/Sq Ft
Est. Value
About This Home
This home is located at 2826 N Talman Ave, Chicago, IL 60618 and is currently estimated at $777,781, approximately $320 per square foot. 2826 N Talman Ave is a home located in Cook County with nearby schools including Brentano Math & Science Academy, Schurz High School, and Alphonsus Academy & Center for the Arts.
Ownership History
Date
Name
Owned For
Owner Type
Purchase Details
Closed on
Dec 15, 2022
Sold by
Martino Paul H
Bought by
Paul H Martino Revocable Trust and Raymond B Pitt Revocable Trust
Current Estimated Value
Purchase Details
Closed on
Nov 4, 2008
Sold by
Herman Scott A
Bought by
Duermit Brian
Home Financials for this Owner
Home Financials are based on the most recent Mortgage that was taken out on this home.
Original Mortgage
$396,800
Interest Rate
6.09%
Mortgage Type
Unknown
Purchase Details
Closed on
Mar 3, 2008
Sold by
The Scott A Herman Trust
Bought by
Herman Scott A
Purchase Details
Closed on
Sep 5, 2002
Sold by
Herman Scott A and Hansen Guy R
Bought by
Herman Scott A and Hansen Guy R
Purchase Details
Closed on
Oct 16, 2000
Sold by
Fertel Corey S and Fertel Rebecca R
Bought by
Herman Scott A and Hansen Guy R
Home Financials for this Owner
Home Financials are based on the most recent Mortgage that was taken out on this home.
Original Mortgage
$320,000
Interest Rate
7.91%
Create a Home Valuation Report for This Property
The Home Valuation Report is an in-depth analysis detailing your home's value as well as a comparison with similar homes in the area
Home Values in the Area
Average Home Value in this Area
Purchase History
| Date | Buyer | Sale Price | Title Company |
|---|---|---|---|
| Paul H Martino Revocable Trust | -- | None Listed On Document | |
| Duermit Brian | $496,000 | None Available | |
| Herman Scott A | -- | None Available | |
| Herman Scott A | -- | -- | |
| Herman Scott A | $400,000 | -- |
Source: Public Records
Mortgage History
| Date | Status | Borrower | Loan Amount |
|---|---|---|---|
| Previous Owner | Duermit Brian | $396,800 | |
| Previous Owner | Herman Scott A | $320,000 |
Source: Public Records
Tax History
| Year | Tax Paid | Tax Assessment Tax Assessment Total Assessment is a certain percentage of the fair market value that is determined by local assessors to be the total taxable value of land and additions on the property. | Land | Improvement |
|---|---|---|---|---|
| 2025 | $10,375 | $56,000 | $6,566 | $49,434 |
| 2024 | $10,375 | $56,000 | $6,566 | $49,434 |
| 2023 | $10,113 | $49,000 | $5,295 | $43,705 |
| 2022 | $10,113 | $49,000 | $5,295 | $43,705 |
| 2021 | $9,886 | $49,000 | $5,295 | $43,705 |
| 2020 | $10,060 | $44,997 | $3,018 | $41,979 |
| 2019 | $9,971 | $49,448 | $3,018 | $46,430 |
| 2018 | $9,768 | $49,448 | $3,018 | $46,430 |
| 2017 | $8,562 | $39,775 | $2,647 | $37,128 |
| 2016 | $7,966 | $39,775 | $2,647 | $37,128 |
| 2015 | $7,289 | $39,775 | $2,647 | $37,128 |
| 2014 | $6,593 | $35,536 | $2,118 | $33,418 |
| 2013 | $6,463 | $35,536 | $2,118 | $33,418 |
Source: Public Records
Map
Nearby Homes
- 2826 N Talman Ave Unit A
- 2612 W Diversey Ave Unit 101
- 2814 N Maplewood Ave
- 2942 N Elston Ave Unit 2
- 2947 N Washtenaw Ave
- 2832 N Mozart St
- 3013 N California Ave Unit 3S
- 2730 N Western Ave
- 2620 N Mozart St
- 2721 N Western Ave
- 2307 W Wolfram St Unit 312
- 2317 W Wolfram St Unit 513
- 2317 W Wolfram St Unit 415
- 2817 N Sacramento Ave
- 2849 W Fletcher St
- 2430 N Washtenaw Ave Unit 3N
- 2435 W Belmont Ave Unit 2E
- 2852 W Fletcher St
- 2451 N Campbell Ave
- 2235 W Oakdale Ave Unit 4-D
- 2826 N Talman Ave
- 2826 N Talman Ave
- 2826 N Talman Ave
- 2826 N Talman Ave
- 2826 N Talman Ave
- 2826 N Talman Ave
- 2826 N Talman Ave
- 2826 N Talman Ave
- 2826 N Talman Ave
- 2826 N Talman Ave
- 2826 N Talman Ave Unit D4
- 2826 N Talman Ave
- 2826 N Talman Ave
- 2826 N Talman Ave Unit K
- 2826 N Talman Ave Unit B
- 2826 N Talman Ave Unit M
- 2826 N Talman Ave Unit F
- 2826 N Talman Ave Unit O
- 2826 N Talman Ave Unit C
- 2826 N Talman Ave Unit J
Your Personal Tour Guide
Ask me questions while you tour the home.