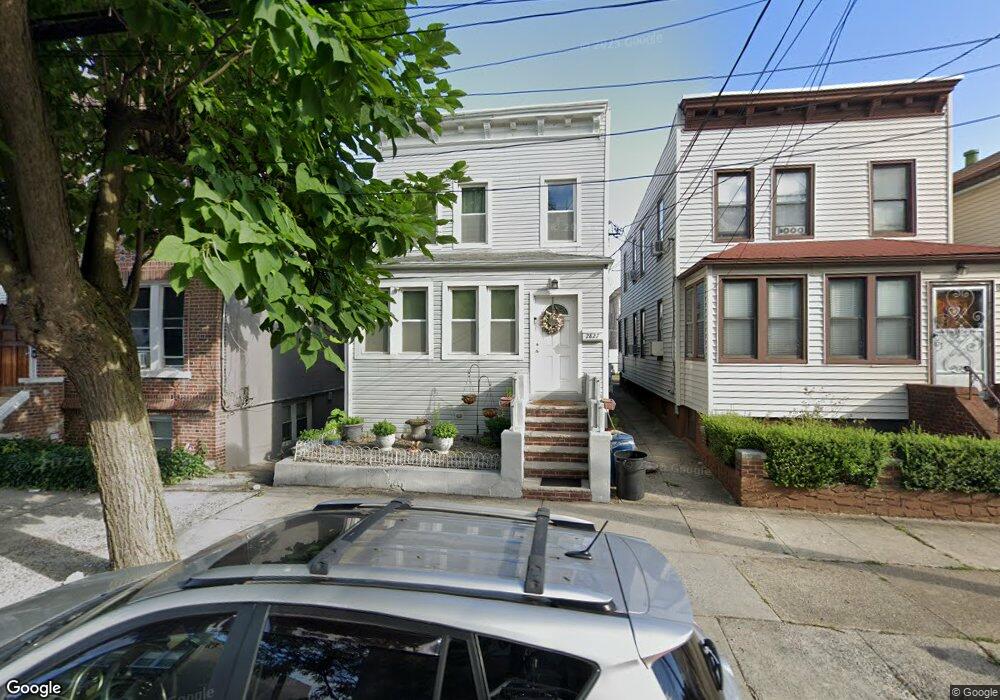
2827 Harrington Ave Bronx, NY 10461
Schuylerville NeighborhoodEstimated Value: $583,000 - $800,000
Studio
--
Bath
1,330
Sq Ft
$508/Sq Ft
Est. Value
About This Home
This home is located at 2827 Harrington Ave, Bronx, NY 10461 and is currently estimated at $675,643, approximately $508 per square foot. 2827 Harrington Ave is a home located in Bronx County with nearby schools including P.S. 71 Rose E Scala and Herbert H Lehman High School.
Ownership History
Date
Name
Owned For
Owner Type
Purchase Details
Closed on
Mar 11, 2011
Sold by
Alicea Alejandro
Bought by
Alicea Alejandro and Alicea Mildred
Current Estimated Value
Purchase Details
Closed on
Aug 9, 1999
Sold by
Ayala Angel L
Bought by
Alicea Alejandro
Home Financials for this Owner
Home Financials are based on the most recent Mortgage that was taken out on this home.
Original Mortgage
$182,700
Interest Rate
7.73%
Purchase Details
Closed on
Sep 22, 1995
Sold by
Saffie Samsodeen and Khan Ali
Bought by
Ayala Angel L
Home Financials for this Owner
Home Financials are based on the most recent Mortgage that was taken out on this home.
Original Mortgage
$178,937
Interest Rate
7.37%
Mortgage Type
FHA
Purchase Details
Closed on
Jul 22, 1994
Sold by
Black Robert S and Reiman Frank
Bought by
Saffie Samsodeen and Khan Ali
Create a Home Valuation Report for This Property
The Home Valuation Report is an in-depth analysis detailing your home's value as well as a comparison with similar homes in the area
Home Values in the Area
Average Home Value in this Area
Purchase History
| Date | Buyer | Sale Price | Title Company |
|---|---|---|---|
| Alicea Alejandro | -- | -- | |
| Alicea Alejandro | $203,000 | Regal Title Agency | |
| Ayala Angel L | $185,000 | First American Title Ins Co | |
| Saffie Samsodeen | $72,000 | Uslife Title Insurance Compa |
Source: Public Records
Mortgage History
| Date | Status | Borrower | Loan Amount |
|---|---|---|---|
| Previous Owner | Alicea Alejandro | $182,700 | |
| Previous Owner | Ayala Angel L | $178,937 |
Source: Public Records
Tax History
| Year | Tax Paid | Tax Assessment Tax Assessment Total Assessment is a certain percentage of the fair market value that is determined by local assessors to be the total taxable value of land and additions on the property. | Land | Improvement |
|---|---|---|---|---|
| 2025 | $5,296 | $27,769 | $5,774 | $21,995 |
| 2024 | $5,296 | $27,768 | $6,065 | $21,703 |
| 2023 | $5,120 | $26,611 | $5,918 | $20,693 |
| 2022 | $4,898 | $37,920 | $8,820 | $29,100 |
| 2021 | $4,854 | $31,980 | $8,820 | $23,160 |
| 2020 | $4,602 | $31,800 | $8,820 | $22,980 |
| 2019 | $4,548 | $28,200 | $8,820 | $19,380 |
| 2018 | $4,223 | $22,176 | $6,863 | $15,313 |
| 2017 | $4,112 | $21,644 | $6,962 | $14,682 |
| 2016 | $3,772 | $20,420 | $6,469 | $13,951 |
| 2015 | $2,243 | $19,284 | $7,666 | $11,618 |
| 2014 | $2,243 | $19,284 | $8,930 | $10,354 |
Source: Public Records
Map
Nearby Homes
- 2819 Coddington Ave
- 1465 Mayflower Ave
- 1448 Edwards Ave
- 1318 Mayflower Ave
- 2888 Wellman Ave
- 2877 Waterbury Ave
- 2806 Wellman Ave
- 2867 Zulette Ave
- 2871 Zulette Ave
- 1276 Edison Ave Unit A
- 2873 Roebling Ave
- 2976 Waterbury Ave
- 1517 Gillespie Ave
- 1292 Crosby Ave
- 2902 Baisley Ave
- 1304 Hobart Ave
- 1271 Hobart Ave
- 1235 Crosby Ave
- 2932 Baisley Ave
- 1627 Pilgrim Ave
- 2829 Harrington Ave
- 2825 Harrington Ave
- 2823 Harrington Ave
- 2831 Harrington Ave
- 2821 Harrington Ave
- 2826 Dudley Ave
- 2824 Dudley Ave
- 2828 Dudley Ave
- 2819 Harrington Ave
- 2830 Dudley Ave
- 2822 Dudley Ave
- 2835 Harrington Ave
- 2832 Dudley Ave
- 2820 Dudley Ave
- 2817 Harrington Ave
- 2840 Dudley Ave
- 2818 Dudley Ave
- 2841 Harrington Ave
- 2842 Dudley Ave
- 2816 Dudley Ave
Your Personal Tour Guide
Ask me questions while you tour the home.