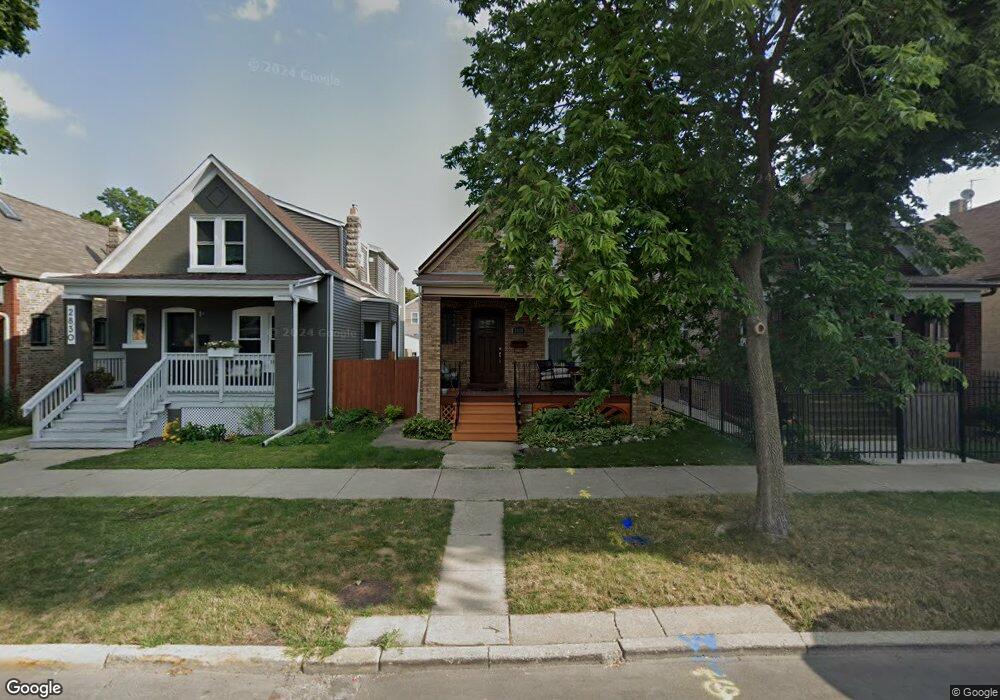
2828 W Barry Ave Chicago, IL 60618
Avondale NeighborhoodEstimated Value: $625,000 - $774,000
4
Beds
2
Baths
1,584
Sq Ft
$441/Sq Ft
Est. Value
About This Home
This home is located at 2828 W Barry Ave, Chicago, IL 60618 and is currently estimated at $698,364, approximately $440 per square foot. 2828 W Barry Ave is a home located in Cook County with nearby schools including Linne Elementary School, Schurz High School, and Acero Charter - Carlos Fuentes Cmpus.
Ownership History
Date
Name
Owned For
Owner Type
Purchase Details
Closed on
Jan 29, 2021
Sold by
West Donald J and Zlatanovski Michelle
Bought by
West Donald J and Zlatanovski Michelle
Current Estimated Value
Home Financials for this Owner
Home Financials are based on the most recent Mortgage that was taken out on this home.
Original Mortgage
$220,000
Outstanding Balance
$180,542
Interest Rate
3%
Mortgage Type
New Conventional
Estimated Equity
$517,822
Purchase Details
Closed on
Jan 30, 2008
Sold by
Watts David C and West Donald J
Bought by
West Donald J
Purchase Details
Closed on
May 21, 2003
Sold by
Malanik James and Malanik Rosemary
Bought by
Watts David C and West Donald J
Home Financials for this Owner
Home Financials are based on the most recent Mortgage that was taken out on this home.
Original Mortgage
$235,600
Interest Rate
4.71%
Mortgage Type
Unknown
Create a Home Valuation Report for This Property
The Home Valuation Report is an in-depth analysis detailing your home's value as well as a comparison with similar homes in the area
Home Values in the Area
Average Home Value in this Area
Purchase History
| Date | Buyer | Sale Price | Title Company |
|---|---|---|---|
| West Donald J | -- | Near North Title Group Llc | |
| West Donald J | -- | None Available | |
| Watts David C | $248,000 | -- | |
| Watts David C | $248,000 | -- |
Source: Public Records
Mortgage History
| Date | Status | Borrower | Loan Amount |
|---|---|---|---|
| Open | West Donald J | $220,000 | |
| Closed | Watts David C | $235,600 |
Source: Public Records
Tax History Compared to Growth
Tax History
| Year | Tax Paid | Tax Assessment Tax Assessment Total Assessment is a certain percentage of the fair market value that is determined by local assessors to be the total taxable value of land and additions on the property. | Land | Improvement |
|---|---|---|---|---|
| 2024 | $9,885 | $48,000 | $23,250 | $24,750 |
| 2023 | $9,613 | $50,000 | $18,750 | $31,250 |
| 2022 | $9,613 | $50,000 | $18,750 | $31,250 |
| 2021 | $9,416 | $50,000 | $18,750 | $31,250 |
| 2020 | $7,916 | $38,510 | $10,687 | $27,823 |
| 2019 | $7,842 | $42,319 | $10,687 | $31,632 |
| 2018 | $7,681 | $42,319 | $10,687 | $31,632 |
| 2017 | $6,870 | $35,287 | $9,375 | $25,912 |
| 2016 | $6,567 | $35,287 | $9,375 | $25,912 |
| 2015 | $5,985 | $35,287 | $9,375 | $25,912 |
| 2014 | $5,405 | $31,699 | $7,500 | $24,199 |
| 2013 | $5,287 | $31,699 | $7,500 | $24,199 |
Source: Public Records
Map
Nearby Homes
- 3101 N California Ave Unit 3N
- 3140 N Elston Ave Unit 3N
- 3209 N Elston Ave Unit 2S
- 2733 W Nelson St
- 3215 N Francisco Ave Unit 3S
- 2732 W Belmont Ave
- 2723 W Wellington Ave Unit 1
- 2644 W Wellington Ave
- 2927 N Sacramento Ave
- 3035 W Belmont Ave Unit 3E
- 2623 W Belmont Ave Unit 3
- 2622 W Wellington Ave
- 2928 N Sacramento Ave
- 3312 N California Ave
- 3314 N California Ave
- 2924 N Talman Ave Unit 3
- 2832 N Mozart St
- 3039 N Troy St Unit 2E
- 3234 N Albany Ave
- 3122 W Belmont Ave
- 2824 W Barry Ave Unit 1
- 2830 W Barry Ave
- 2834 W Barry Ave
- 2822 W Barry Ave
- 2836 W Barry Ave
- 2818 W Barry Ave Unit G1
- 2818 W Barry Ave
- 2840 W Barry Ave
- 2814 W Barry Ave Unit 1
- 2814 W Barry Ave Unit 2
- 2829 W Fletcher St
- 2827 W Fletcher St
- 2831 W Fletcher St
- 2842 W Barry Ave
- 2842 W Barry Ave
- 2823 W Fletcher St
- 2810 W Barry Ave Unit 2W
- 2810 W Barry Ave Unit 3W
- 2810 W Barry Ave Unit 3E
- 2810 W Barry Ave Unit 1W