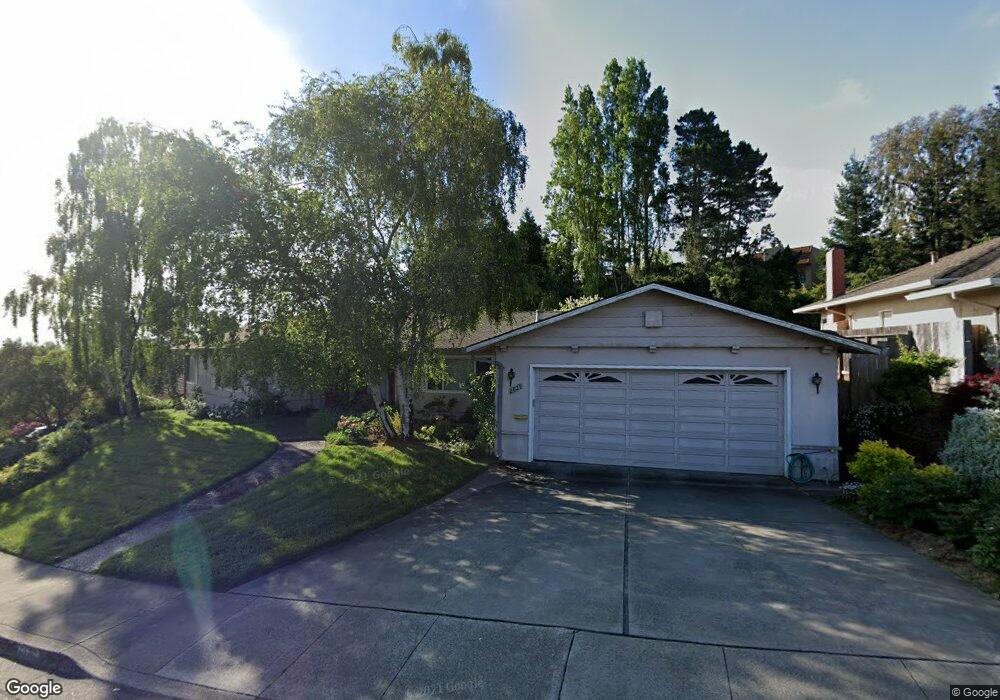
2829 Benson Way Belmont, CA 94002
Belmont Woods NeighborhoodEstimated Value: $2,853,796 - $3,655,000
4
Beds
3
Baths
2,350
Sq Ft
$1,378/Sq Ft
Est. Value
About This Home
This home is located at 2829 Benson Way, Belmont, CA 94002 and is currently estimated at $3,238,699, approximately $1,378 per square foot. 2829 Benson Way is a home located in San Mateo County with nearby schools including Ralston Intermediate School, Carlmont High School, and Immaculate Heart of Mary School.
Ownership History
Date
Name
Owned For
Owner Type
Purchase Details
Closed on
Feb 10, 1999
Sold by
Takemori Frank and Takemori Amy
Bought by
Takemori Frank and Takemori Amy
Current Estimated Value
Home Financials for this Owner
Home Financials are based on the most recent Mortgage that was taken out on this home.
Original Mortgage
$358,000
Interest Rate
6.41%
Purchase Details
Closed on
Aug 4, 1998
Sold by
Takemori Frank and Takemori Amy
Bought by
Takemori Frank and Takemori Amy
Purchase Details
Closed on
Feb 20, 1998
Sold by
Wallis Paul F and Wallis Shirley C
Bought by
Takemori Frank and Takemori Amy
Home Financials for this Owner
Home Financials are based on the most recent Mortgage that was taken out on this home.
Original Mortgage
$561,000
Interest Rate
7.37%
Purchase Details
Closed on
Dec 31, 1997
Sold by
Wallis Paul F and Wallis Shirley C
Bought by
Wallis Paul F and Wallis Shirley C
Home Financials for this Owner
Home Financials are based on the most recent Mortgage that was taken out on this home.
Original Mortgage
$561,000
Interest Rate
7.37%
Purchase Details
Closed on
Jun 13, 1996
Sold by
Wallis Paul F and Wallis Shirley C
Bought by
Wallis Paul F and Wallis Shirley C
Create a Home Valuation Report for This Property
The Home Valuation Report is an in-depth analysis detailing your home's value as well as a comparison with similar homes in the area
Home Values in the Area
Average Home Value in this Area
Purchase History
| Date | Buyer | Sale Price | Title Company |
|---|---|---|---|
| Takemori Frank | -- | -- | |
| Takemori Frank | -- | Fidelity National Title Co | |
| Takemori Frank | -- | -- | |
| Takemori Frank | $761,000 | Fidelity National Title Co | |
| Wallis Paul F | -- | Stewart Title | |
| Wallis Paul | -- | Stewart Title | |
| Wallis Paul F | -- | -- |
Source: Public Records
Mortgage History
| Date | Status | Borrower | Loan Amount |
|---|---|---|---|
| Closed | Takemori Frank | $358,000 | |
| Previous Owner | Takemori Frank | $561,000 | |
| Previous Owner | Wallis Paul | $200,000 |
Source: Public Records
Tax History
| Year | Tax Paid | Tax Assessment Tax Assessment Total Assessment is a certain percentage of the fair market value that is determined by local assessors to be the total taxable value of land and additions on the property. | Land | Improvement |
|---|---|---|---|---|
| 2025 | $14,750 | $1,215,118 | $607,559 | $607,559 |
| 2023 | $14,750 | $1,167,936 | $583,968 | $583,968 |
| 2022 | $13,913 | $1,145,036 | $572,518 | $572,518 |
| 2021 | $13,848 | $1,122,586 | $561,293 | $561,293 |
| 2020 | $13,612 | $1,111,076 | $555,538 | $555,538 |
| 2019 | $14,163 | $1,089,292 | $544,646 | $544,646 |
| 2018 | $13,058 | $1,067,934 | $533,967 | $533,967 |
| 2017 | $12,768 | $1,046,996 | $523,498 | $523,498 |
| 2016 | $12,475 | $1,026,468 | $513,234 | $513,234 |
| 2015 | $12,505 | $1,011,050 | $505,525 | $505,525 |
| 2014 | $12,007 | $991,246 | $495,623 | $495,623 |
Source: Public Records
Map
Nearby Homes
- 25 Rinconada Cir
- 1 Rinconada Cir
- 2758 Belmont Canyon Rd
- 2741 Belmont Canyon Rd
- 3860 W Naughton Ave
- 0 Ralston Ave Unit ML81985419
- 0 W Naughton Ave
- 3900 Marsten Ave
- 3311 Plateau Dr
- 3900-A Marsten Ave
- 4112 Marsten Ave
- 0 Lower Lock Ave
- 117 Lakewood Cir
- 3528 Broadview Ct
- 2937 San Juan Blvd
- 2827 San Ardo Way
- 0 Bartlett Way Unit ML82003351
- 0 Marburger Ave
- 2056 Fairmont Dr
- 0 Monte Cresta Dr
- 2825 Benson Way
- 2837 Benson Way
- 2821 Benson Way
- 5 Heritage Ct
- 9 Heritage Ct
- 2832 Benson Way
- 1 Heritage Ct
- 13 Heritage Ct
- 2836 Benson Way
- 2828 Benson Way
- 17 Heritage Ct
- 21 Heritage Ct
- 2824 Benson Way
- 2817 Benson Way
- 2820 Benson Way
- 3019 Saint James Rd
- 3023 Saint James Rd
- 3015 Saint James Rd
- 3011 Saint James Rd
- 3027 Saint James Rd
Your Personal Tour Guide
Ask me questions while you tour the home.