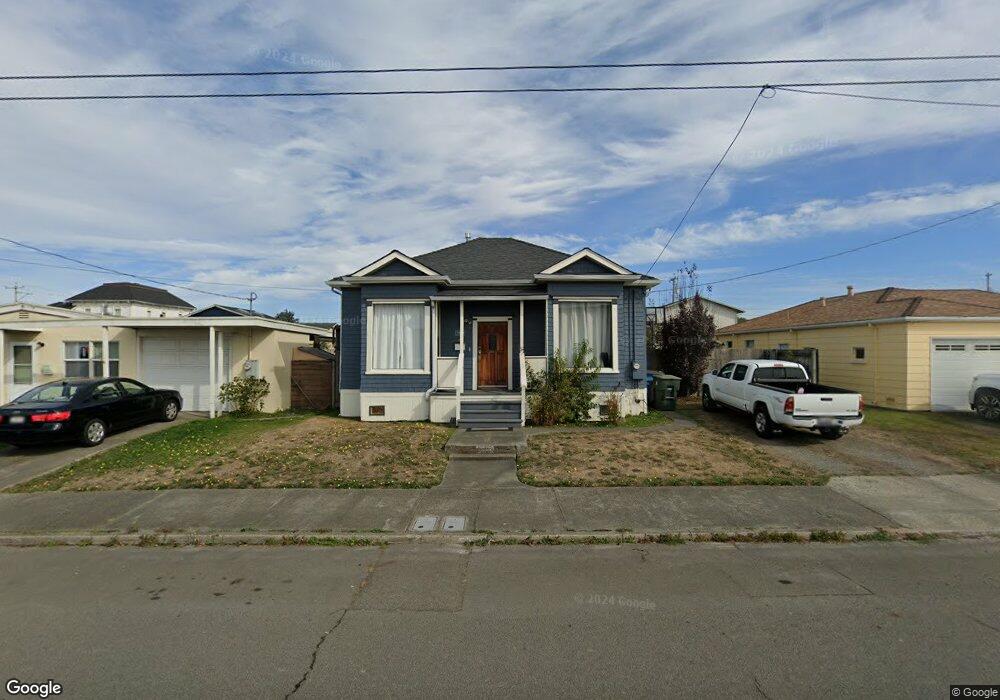
2829 Union St Eureka, CA 95501
Fairfield NeighborhoodEstimated Value: $318,000 - $336,000
3
Beds
1
Bath
1,509
Sq Ft
$217/Sq Ft
Est. Value
About This Home
This home is located at 2829 Union St, Eureka, CA 95501 and is currently estimated at $328,165, approximately $217 per square foot. 2829 Union St is a home located in Humboldt County with nearby schools including Alice Birney Elementary School, Winship Middle School, and Eureka Senior High School.
Ownership History
Date
Name
Owned For
Owner Type
Purchase Details
Closed on
Sep 23, 2019
Sold by
Michael Herrera Donald
Bought by
Nova Casey
Current Estimated Value
Home Financials for this Owner
Home Financials are based on the most recent Mortgage that was taken out on this home.
Original Mortgage
$97,500
Outstanding Balance
$85,215
Interest Rate
3.6%
Mortgage Type
New Conventional
Estimated Equity
$242,950
Purchase Details
Closed on
Jun 5, 2003
Sold by
Nova Walter
Bought by
Nova Walter and Herrera Donald Michael
Create a Home Valuation Report for This Property
The Home Valuation Report is an in-depth analysis detailing your home's value as well as a comparison with similar homes in the area
Home Values in the Area
Average Home Value in this Area
Purchase History
| Date | Buyer | Sale Price | Title Company |
|---|---|---|---|
| Nova Casey | $123,000 | Fidelity National Title | |
| Nova Casey | -- | Fidelity National Title | |
| Herrera Donald Michael | -- | -- | |
| Nova Walter | -- | -- |
Source: Public Records
Mortgage History
| Date | Status | Borrower | Loan Amount |
|---|---|---|---|
| Open | Nova Casey | $97,500 | |
| Closed | Nova Casey | $97,500 |
Source: Public Records
Tax History
| Year | Tax Paid | Tax Assessment Tax Assessment Total Assessment is a certain percentage of the fair market value that is determined by local assessors to be the total taxable value of land and additions on the property. | Land | Improvement |
|---|---|---|---|---|
| 2025 | $1,951 | $196,852 | $98,426 | $98,426 |
| 2024 | $1,951 | $192,994 | $96,497 | $96,497 |
| 2023 | $1,922 | $189,210 | $94,605 | $94,605 |
| 2022 | $1,994 | $185,500 | $92,750 | $92,750 |
| 2021 | $1,866 | $181,864 | $90,932 | $90,932 |
| 2020 | $1,866 | $31,818 | $10,307 | $21,511 |
| 2019 | $333 | $31,195 | $10,105 | $21,090 |
| 2018 | $328 | $30,584 | $9,907 | $20,677 |
| 2017 | $327 | $29,985 | $9,713 | $20,272 |
| 2016 | $327 | $29,398 | $9,523 | $19,875 |
| 2015 | $324 | $28,957 | $9,380 | $19,577 |
| 2014 | $303 | $28,391 | $9,197 | $19,194 |
Source: Public Records
Map
Nearby Homes
- 318 W Harris St
- 507 W Everding St
- 2950 California St
- 2613 Spring St
- 2805 California St
- 2738 A St
- 2533 Garland St
- 3124 Ingley St
- 2713 A St
- 3316 Ingley St
- 3402 California St
- 2303 Union St
- 2249 Union St
- 3206 Lowell St
- 2434 C St
- 136 Randolph St
- 3324 Lowell St
- 2135 California St
- 2036 Albee St
- 516 W Hawthorne St
Your Personal Tour Guide
Ask me questions while you tour the home.