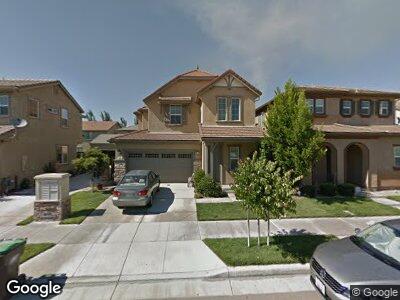
283 Lazy Ridge Ave Lathrop, CA 95330
Estimated Value: $610,000 - $641,361
3
Beds
2
Baths
2,350
Sq Ft
$269/Sq Ft
Est. Value
About This Home
This home is located at 283 Lazy Ridge Ave, Lathrop, CA 95330 and is currently estimated at $631,090, approximately $268 per square foot. 283 Lazy Ridge Ave is a home located in San Joaquin County with nearby schools including Mossdale Elementary School, Lathrop High School, and Nextgeneration Steam Academy.
Ownership History
Date
Name
Owned For
Owner Type
Purchase Details
Closed on
May 21, 2013
Sold by
Patang Habiba
Bought by
Patang Habiba and The Hiba Patang Living Trust
Current Estimated Value
Purchase Details
Closed on
Jul 6, 2009
Sold by
The Bank Of New York
Bought by
Patang Abdul K and Patang Habiba
Home Financials for this Owner
Home Financials are based on the most recent Mortgage that was taken out on this home.
Original Mortgage
$128,000
Outstanding Balance
$86,223
Interest Rate
5.31%
Mortgage Type
Purchase Money Mortgage
Estimated Equity
$543,038
Purchase Details
Closed on
Oct 20, 2008
Sold by
Gotoc Janet
Bought by
The Bank Of New York
Purchase Details
Closed on
Aug 30, 2006
Sold by
Gotoc Benigno G
Bought by
Gotoc Janet
Home Financials for this Owner
Home Financials are based on the most recent Mortgage that was taken out on this home.
Original Mortgage
$405,200
Interest Rate
8.37%
Mortgage Type
Purchase Money Mortgage
Create a Home Valuation Report for This Property
The Home Valuation Report is an in-depth analysis detailing your home's value as well as a comparison with similar homes in the area
Home Values in the Area
Average Home Value in this Area
Purchase History
| Date | Buyer | Sale Price | Title Company |
|---|---|---|---|
| Patang Habiba | -- | None Available | |
| Patang Abdul K | $165,000 | First American Title Company | |
| The Bank Of New York | $169,150 | Landsafe Title | |
| Gotoc Janet | -- | First American Title Co | |
| Gotoc Janet | $507,000 | First American Title Co |
Source: Public Records
Mortgage History
| Date | Status | Borrower | Loan Amount |
|---|---|---|---|
| Open | Patang Abdul K | $128,000 | |
| Previous Owner | Gotoc Janet | $405,200 | |
| Previous Owner | Gotoc Janet | $101,300 |
Source: Public Records
Tax History Compared to Growth
Tax History
| Year | Tax Paid | Tax Assessment Tax Assessment Total Assessment is a certain percentage of the fair market value that is determined by local assessors to be the total taxable value of land and additions on the property. | Land | Improvement |
|---|---|---|---|---|
| 2024 | $3,807 | $208,795 | $51,880 | $156,915 |
| 2023 | $3,679 | $204,702 | $50,863 | $153,839 |
| 2022 | $3,631 | $200,689 | $49,866 | $150,823 |
| 2021 | $3,547 | $196,755 | $48,889 | $147,866 |
| 2020 | $3,441 | $194,738 | $48,388 | $146,350 |
| 2019 | $3,388 | $190,921 | $47,440 | $143,481 |
| 2018 | $3,329 | $187,178 | $46,510 | $140,668 |
| 2017 | $3,274 | $183,509 | $45,599 | $137,910 |
| 2016 | $3,280 | $179,913 | $44,706 | $135,207 |
| 2014 | $3,095 | $173,742 | $43,172 | $130,570 |
Source: Public Records
Map
Nearby Homes
- 238 American Farms Ave
- 300 Brookhurst Blvd & McKee Blvd
- 300 Brookhurst Blvd & McKee Blvd
- 300 Brookhurst Blvd & McKee Blvd
- 17736 Mckee Blvd
- 17806 Mckee Blvd
- 17828 Mckee Blvd
- 17852 Mckee Blvd
- 17776 Mckee Blvd
- 17870 Mckee Blvd
- 17385 Stone Celler Way
- 17765 Daffodil Hill St
- 17875 Mckee Blvd
- 17127 Hickory Oak Ln
- 491 Danbury Place
- 558 Millpond Ave
- 776 Open Range Ave
- 17002 Pecan Hollow Way
- 18401 Waterfront Way
- 18429 Waterfront Way
- 283 Lazy Ridge Ave
- 269 Lazy Ridge Ave
- 297 Lazy Ridge Ave
- 255 Lazy Ridge Ave
- 307 Lazy Ridge Ave
- 274 American Farms Ave
- 282 American Farms Ave
- 266 American Farms Ave
- 300 American Farms Ave
- 241 Lazy Ridge Ave
- 250 American Farms Ave
- 319 Lazy Ridge Ave
- 312 American Farms Ave
- 280 Lazy Ridge Ave
- 268 Lazy Ridge Ave
- 298 Lazy Ridge Ave
- 256 Lazy Ridge Ave
- 308 Lazy Ridge Ave
- 225 Lazy Ridge Ave
- 331 Lazy Ridge Ave