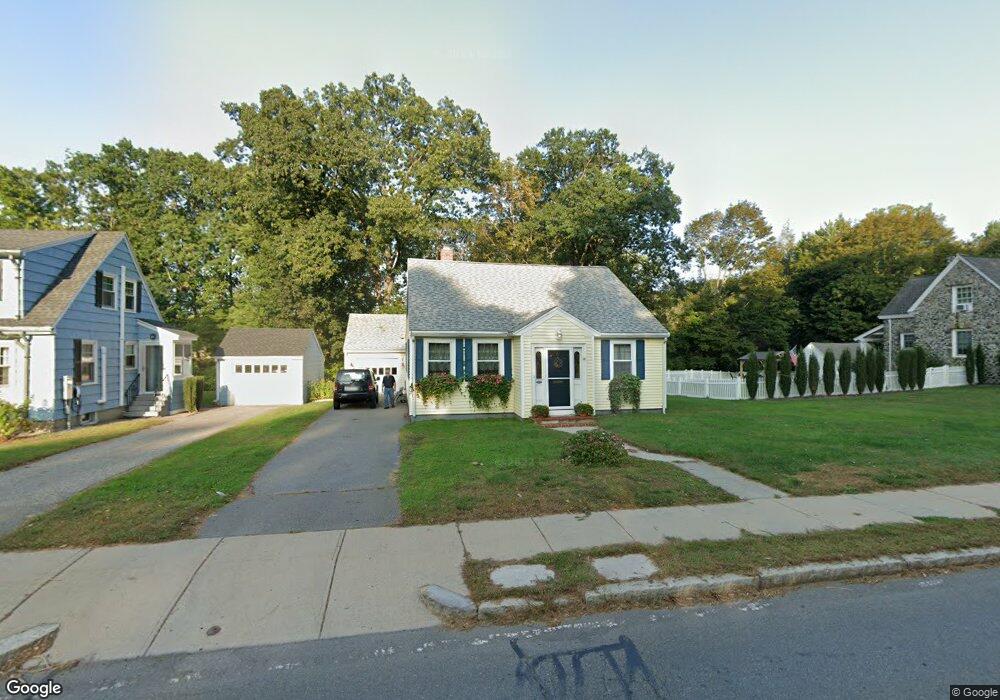
283 N Main St Andover, MA 01810
Shawsheen Heights NeighborhoodEstimated Value: $617,000 - $778,000
3
Beds
1
Bath
1,665
Sq Ft
$418/Sq Ft
Est. Value
About This Home
This home is located at 283 N Main St, Andover, MA 01810 and is currently estimated at $696,155, approximately $418 per square foot. 283 N Main St is a home located in Essex County with nearby schools including West Elementary School, Andover West Middle School, and Andover High School.
Ownership History
Date
Name
Owned For
Owner Type
Purchase Details
Closed on
Aug 14, 2014
Sold by
Hall Virgina and Irvine Virgina H
Bought by
Virginia Hall T and Virginia Hall
Current Estimated Value
Purchase Details
Closed on
Jan 25, 2005
Sold by
Irvine James W and Irvine Virginia Hall
Bought by
Irvine Virginia Hall
Home Financials for this Owner
Home Financials are based on the most recent Mortgage that was taken out on this home.
Original Mortgage
$200,000
Interest Rate
5.71%
Mortgage Type
Purchase Money Mortgage
Purchase Details
Closed on
Aug 17, 1993
Sold by
Merrimack Mutual Fire
Bought by
Irvine James W
Create a Home Valuation Report for This Property
The Home Valuation Report is an in-depth analysis detailing your home's value as well as a comparison with similar homes in the area
Home Values in the Area
Average Home Value in this Area
Purchase History
| Date | Buyer | Sale Price | Title Company |
|---|---|---|---|
| Virginia Hall T | -- | -- | |
| Virginia Hall T | -- | -- | |
| Irvine Virginia Hall | -- | -- | |
| Irvine Virginia Hall | -- | -- | |
| Irvine Virginia Hall | -- | -- | |
| Irvine James W | $118,000 | -- | |
| Irvine James W | $118,000 | -- |
Source: Public Records
Mortgage History
| Date | Status | Borrower | Loan Amount |
|---|---|---|---|
| Previous Owner | Irvine James W | $186,200 | |
| Previous Owner | Irvine Virginia Hall | $200,000 |
Source: Public Records
Tax History Compared to Growth
Tax History
| Year | Tax Paid | Tax Assessment Tax Assessment Total Assessment is a certain percentage of the fair market value that is determined by local assessors to be the total taxable value of land and additions on the property. | Land | Improvement |
|---|---|---|---|---|
| 2024 | $7,371 | $572,300 | $311,800 | $260,500 |
| 2023 | $7,146 | $523,100 | $288,700 | $234,400 |
| 2022 | $6,688 | $458,100 | $244,500 | $213,600 |
| 2021 | $6,391 | $418,000 | $222,300 | $195,700 |
| 2020 | $6,127 | $408,200 | $216,900 | $191,300 |
| 2019 | $6,059 | $396,800 | $210,600 | $186,200 |
| 2018 | $5,774 | $369,200 | $198,500 | $170,700 |
| 2017 | $5,509 | $362,900 | $194,600 | $168,300 |
| 2016 | $5,378 | $362,900 | $194,600 | $168,300 |
| 2015 | $5,171 | $345,400 | $187,100 | $158,300 |
Source: Public Records
Map
Nearby Homes
- 24 York St
- 6 Windsor St
- 5 Castle Heights Rd
- 10 Martingale Ln Unit 10
- 38 Lincoln Cir E
- 156 High St
- 2 Powder Mill Square Unit 2B
- 2 Haskell Rd
- 42 Stevens St
- 20 Walnut Ave
- 1 Longwood Dr Unit 105
- 437 N Main St Unit C
- 21 Clubview Dr Unit 21
- 7-9 Buxton Ct
- 10 Maple Ave Unit 3
- 105 Elm St Unit A
- 102 Weare St
- 61 Elm St Unit 61
- 170 Haverhill St Unit 138
- 25 Clubview Dr Unit 25