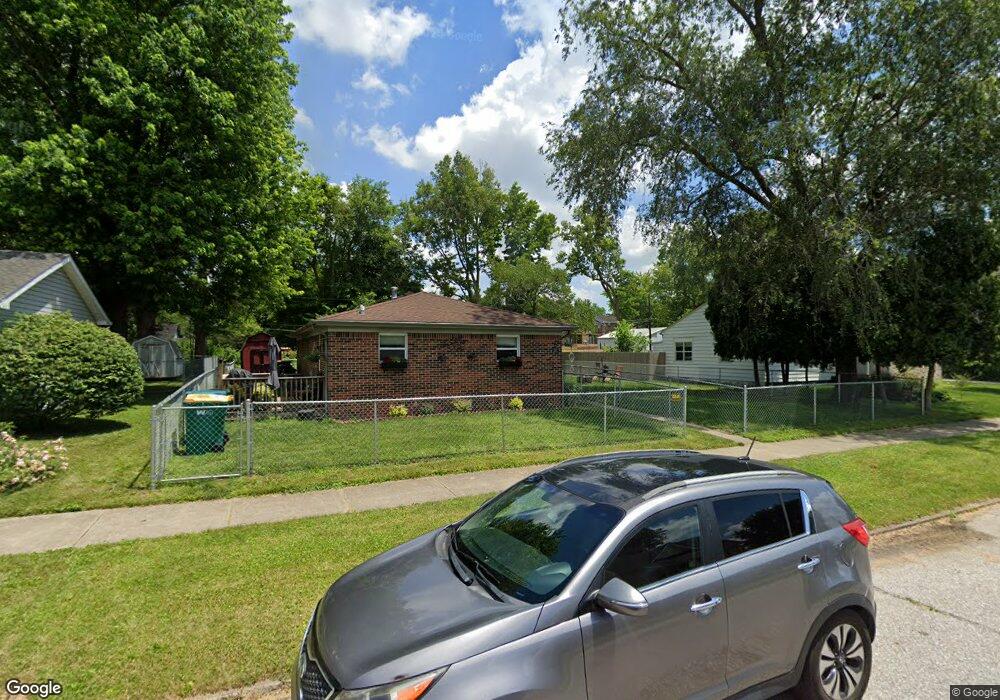
283 N Vine St Plainfield, IN 46168
Estimated Value: $158,150 - $231,000
2
Beds
1
Bath
825
Sq Ft
$244/Sq Ft
Est. Value
About This Home
This home is located at 283 N Vine St, Plainfield, IN 46168 and is currently estimated at $201,038, approximately $243 per square foot. 283 N Vine St is a home located in Hendricks County with nearby schools including Central Elementary School, Plainfield Community Middle School, and Plainfield High School.
Ownership History
Date
Name
Owned For
Owner Type
Purchase Details
Closed on
Sep 18, 2020
Sold by
Hyman Michael and Hyman Phyllis
Bought by
283 285 North Vine St Llc
Current Estimated Value
Purchase Details
Closed on
Nov 3, 2006
Sold by
Neitzel Jimmie D
Bought by
Hyman Michael and Hyman Phyllis
Home Financials for this Owner
Home Financials are based on the most recent Mortgage that was taken out on this home.
Original Mortgage
$92,000
Interest Rate
6.38%
Mortgage Type
New Conventional
Purchase Details
Closed on
Jan 27, 2006
Sold by
Carr Robert R
Bought by
Neitzel Jimmie D
Create a Home Valuation Report for This Property
The Home Valuation Report is an in-depth analysis detailing your home's value as well as a comparison with similar homes in the area
Home Values in the Area
Average Home Value in this Area
Purchase History
| Date | Buyer | Sale Price | Title Company |
|---|---|---|---|
| 283 285 North Vine St Llc | -- | None Available | |
| Hyman Michael | -- | None Available | |
| Neitzel Jimmie D | -- | None Available |
Source: Public Records
Mortgage History
| Date | Status | Borrower | Loan Amount |
|---|---|---|---|
| Previous Owner | Hyman Michael | $92,000 |
Source: Public Records
Tax History Compared to Growth
Tax History
| Year | Tax Paid | Tax Assessment Tax Assessment Total Assessment is a certain percentage of the fair market value that is determined by local assessors to be the total taxable value of land and additions on the property. | Land | Improvement |
|---|---|---|---|---|
| 2024 | $2,356 | $121,500 | $13,700 | $107,800 |
| 2023 | $2,421 | $121,500 | $13,700 | $107,800 |
| 2022 | $2,430 | $121,500 | $13,600 | $107,900 |
| 2021 | $2,431 | $121,500 | $14,700 | $106,800 |
| 2020 | $2,430 | $121,500 | $15,700 | $105,800 |
| 2019 | $2,430 | $156,500 | $20,400 | $136,100 |
| 2018 | $2,342 | $117,100 | $15,700 | $101,400 |
| 2017 | $2,342 | $117,100 | $16,600 | $100,500 |
| 2016 | $2,342 | $117,100 | $17,300 | $99,800 |
| 2014 | $2,342 | $117,100 | $17,300 | $99,800 |
Source: Public Records
Map
Nearby Homes
- 311 N Center St
- 100 Lincoln St
- 325 N Center St
- 225 N Center St
- 147 N Center St
- 2394 Eagle Ave
- 2198 Galleone Way
- 327 S Mill St
- 309 Duffey St
- 1042 W Main St
- 60 Pike Place
- 710 Hanna St
- 550 548 S Center St
- 731 Andrews Blvd
- 628 Gibbs Ct
- 269 Andrews Boulevard East Dr
- 215 Andrews Boulevard East Dr
- 251 Andrews Blvd
- 645 Masten St
- 980 Andico Rd