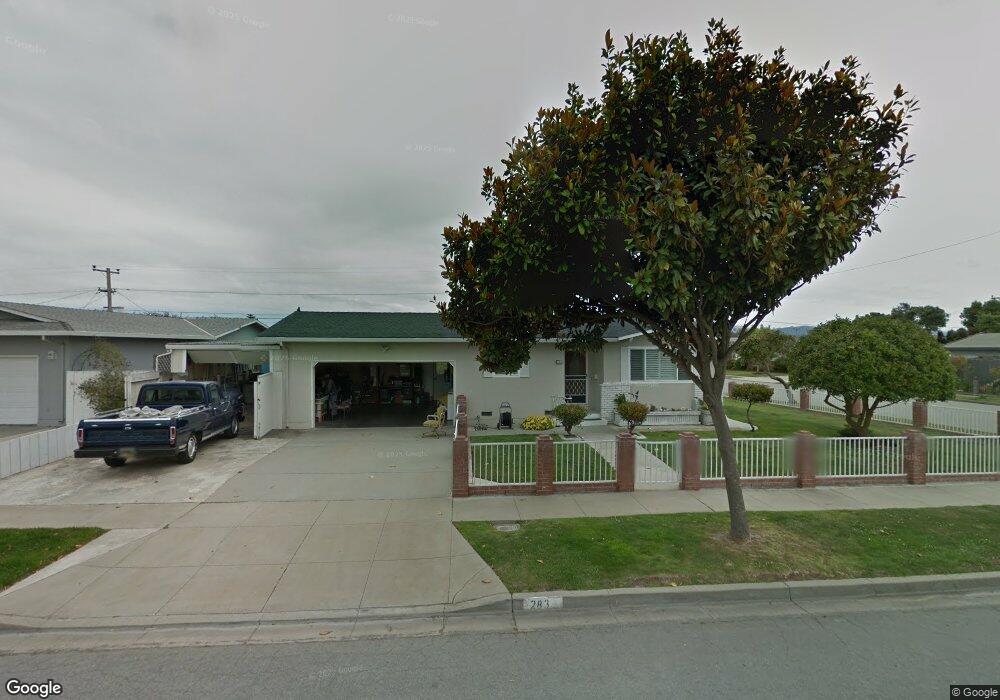
283 Osage Dr Salinas, CA 93906
Northridge NeighborhoodEstimated Value: $646,000 - $679,215
3
Beds
2
Baths
1,200
Sq Ft
$557/Sq Ft
Est. Value
About This Home
This home is located at 283 Osage Dr, Salinas, CA 93906 and is currently estimated at $668,304, approximately $556 per square foot. 283 Osage Dr is a home located in Monterey County with nearby schools including Henry F. Kammann Elementary School, Boronda Meadows Elementary School, and Harden Middle School.
Ownership History
Date
Name
Owned For
Owner Type
Purchase Details
Closed on
Dec 2, 2021
Sold by
Sanchez Felipa
Bought by
Perez Joshua David and Perez Sandra Losoya
Current Estimated Value
Home Financials for this Owner
Home Financials are based on the most recent Mortgage that was taken out on this home.
Original Mortgage
$212,000
Outstanding Balance
$195,063
Interest Rate
3.14%
Mortgage Type
New Conventional
Estimated Equity
$473,241
Create a Home Valuation Report for This Property
The Home Valuation Report is an in-depth analysis detailing your home's value as well as a comparison with similar homes in the area
Home Values in the Area
Average Home Value in this Area
Purchase History
| Date | Buyer | Sale Price | Title Company |
|---|---|---|---|
| Perez Joshua David | $265,000 | Chicago Title Company | |
| Perez Sandra Losoya | -- | Chicago Title Company |
Source: Public Records
Mortgage History
| Date | Status | Borrower | Loan Amount |
|---|---|---|---|
| Open | Perez Joshua David | $212,000 |
Source: Public Records
Tax History
| Year | Tax Paid | Tax Assessment Tax Assessment Total Assessment is a certain percentage of the fair market value that is determined by local assessors to be the total taxable value of land and additions on the property. | Land | Improvement |
|---|---|---|---|---|
| 2025 | $7,047 | $615,500 | $397,953 | $217,547 |
| 2024 | $7,047 | $603,432 | $390,150 | $213,282 |
| 2023 | $6,810 | $591,600 | $382,500 | $209,100 |
| 2022 | $6,558 | $580,000 | $375,000 | $205,000 |
| 2021 | $1,490 | $137,979 | $34,453 | $103,526 |
| 2020 | $1,448 | $136,565 | $34,100 | $102,465 |
| 2019 | $1,435 | $133,888 | $33,432 | $100,456 |
| 2018 | $1,413 | $131,264 | $32,777 | $98,487 |
| 2017 | $1,412 | $128,691 | $32,135 | $96,556 |
| 2016 | $1,411 | $126,168 | $31,505 | $94,663 |
| 2015 | $1,422 | $124,274 | $31,032 | $93,242 |
| 2014 | $1,327 | $121,841 | $30,425 | $91,416 |
Source: Public Records
Map
Nearby Homes
- 344 Pueblo Dr
- 530 Inca Way
- 1515 Aragon Cir
- 1518 Duran Cir
- 1588 Cherokee Dr
- 1520 Ebro Cir
- 1588 Duran St
- 1712 Madrid Cir
- 730 N Main St
- 427 W Laurel Dr Unit A
- 276 Noice Dr
- 1103 Sherman Dr
- 1031 Heather Dr
- 336 Rainier Dr
- 323 Chaparral St
- 233 Montclair Ln
- 217 Iris Dr
- 1421 Amador Cir
- 1445 Amador Cir
- 1829 Delancey Dr
Your Personal Tour Guide
Ask me questions while you tour the home.