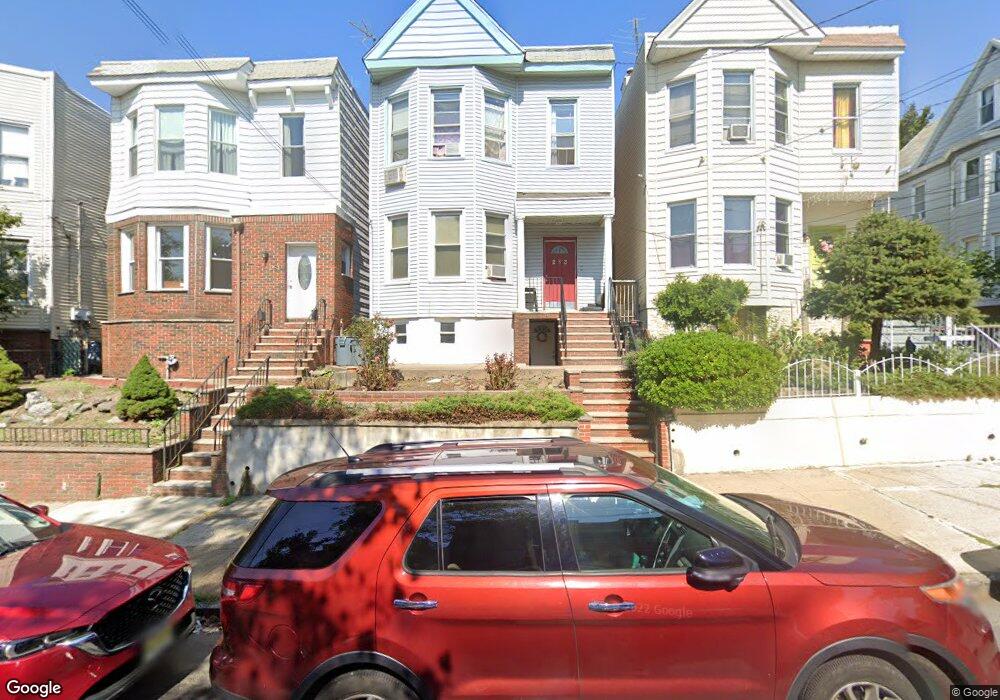
283 Sherman Ave Jersey City, NJ 07307
The Heights NeighborhoodEstimated Value: $890,000 - $1,198,000
--
Bed
--
Bath
2,106
Sq Ft
$499/Sq Ft
Est. Value
About This Home
This home is located at 283 Sherman Ave, Jersey City, NJ 07307 and is currently estimated at $1,050,852, approximately $498 per square foot. 283 Sherman Ave is a home located in Hudson County with nearby schools including Christa McAuliffe School, William L. Dickinson High School, and Dr Ronald McNair High School.
Ownership History
Date
Name
Owned For
Owner Type
Purchase Details
Closed on
Jun 28, 2005
Sold by
Balbuena Vincente and Balbuena Sonia
Bought by
Crawford Anita
Current Estimated Value
Home Financials for this Owner
Home Financials are based on the most recent Mortgage that was taken out on this home.
Original Mortgage
$332,000
Outstanding Balance
$173,420
Interest Rate
5.67%
Mortgage Type
Fannie Mae Freddie Mac
Estimated Equity
$877,432
Purchase Details
Closed on
Aug 15, 1996
Sold by
Ge Capital Mtg Services Inc
Bought by
Balbuena Vincente and Balbuena Sonia
Home Financials for this Owner
Home Financials are based on the most recent Mortgage that was taken out on this home.
Original Mortgage
$68,400
Interest Rate
7.83%
Purchase Details
Closed on
Mar 4, 1996
Sold by
Cassidy Joseph T
Bought by
Ge Capital Mtg Services Inc
Home Financials for this Owner
Home Financials are based on the most recent Mortgage that was taken out on this home.
Original Mortgage
$164,138
Interest Rate
7.98%
Create a Home Valuation Report for This Property
The Home Valuation Report is an in-depth analysis detailing your home's value as well as a comparison with similar homes in the area
Home Values in the Area
Average Home Value in this Area
Purchase History
| Date | Buyer | Sale Price | Title Company |
|---|---|---|---|
| Crawford Anita | $415,000 | Fidelity National Title Co | |
| Balbuena Vincente | $76,000 | -- | |
| Ge Capital Mtg Services Inc | -- | Imperial Title Agency Inc |
Source: Public Records
Mortgage History
| Date | Status | Borrower | Loan Amount |
|---|---|---|---|
| Open | Crawford Anita | $332,000 | |
| Previous Owner | Balbuena Vincente | $68,400 | |
| Previous Owner | Ge Capital Mtg Services Inc | $164,138 |
Source: Public Records
Tax History Compared to Growth
Tax History
| Year | Tax Paid | Tax Assessment Tax Assessment Total Assessment is a certain percentage of the fair market value that is determined by local assessors to be the total taxable value of land and additions on the property. | Land | Improvement |
|---|---|---|---|---|
| 2025 | $11,556 | $517,500 | $240,000 | $277,500 |
| 2024 | $11,628 | $517,500 | $240,000 | $277,500 |
| 2023 | $11,628 | $517,500 | $240,000 | $277,500 |
| 2022 | $10,961 | $517,500 | $240,000 | $277,500 |
| 2021 | $8,301 | $517,500 | $240,000 | $277,500 |
| 2020 | $8,332 | $517,500 | $240,000 | $277,500 |
| 2019 | $7,970 | $517,500 | $240,000 | $277,500 |
| 2018 | $1,713 | $517,500 | $240,000 | $277,500 |
| 2017 | $8,978 | $115,100 | $20,000 | $95,100 |
| 2016 | $8,864 | $115,100 | $20,000 | $95,100 |
| 2015 | $8,612 | $115,100 | $20,000 | $95,100 |
| 2014 | $8,557 | $115,100 | $20,000 | $95,100 |
Source: Public Records
Map
Nearby Homes
- 502 Central Ave Unit D1
- 241 Cambridge Ave
- 464 Central Ave Unit A5
- 11 Irving St Unit 2
- 111 North St
- 28 Graham St
- 27 Graham St
- 372 Webster Ave
- 334 Webster Ave
- 192 Cambridge Ave Unit 3
- 192 Cambridge Ave Unit 2
- 45 Graham St Unit 1
- 244 Sherman Ave Unit A
- 433 Central Ave Unit 3A
- 433 Central Ave Unit PH4
- 433 Central Ave Unit PH5
- 295 Webster Ave
- 371 New York Ave Unit 2
- 200 Paterson Plank Rd Unit 504
- 1097 Summit Ave Unit 2A
- 283 Sherman Ave Unit 1
- 281 Sherman Ave
- 281 Sherman Ave Unit 1
- 285 Sherman Ave
- 285 Sherman Ave Unit 1
- 279 Sherman Ave
- 287 Sherman Ave
- 289 Sherman Ave
- 277 Sherman Ave Unit 1F
- 277 Sherman Ave Unit 1B
- 277 Sherman Ave Unit 1A
- 277 Sherman Ave Unit 102
- 277 Sherman Ave
- 240 Hancock Ave
- 238 Hancock Ave
- 242 Hancock Ave
- 236 Hancock Ave
- 236 Hancock Ave Unit 2
- 291 Sherman Ave
- 244 Hancock Ave