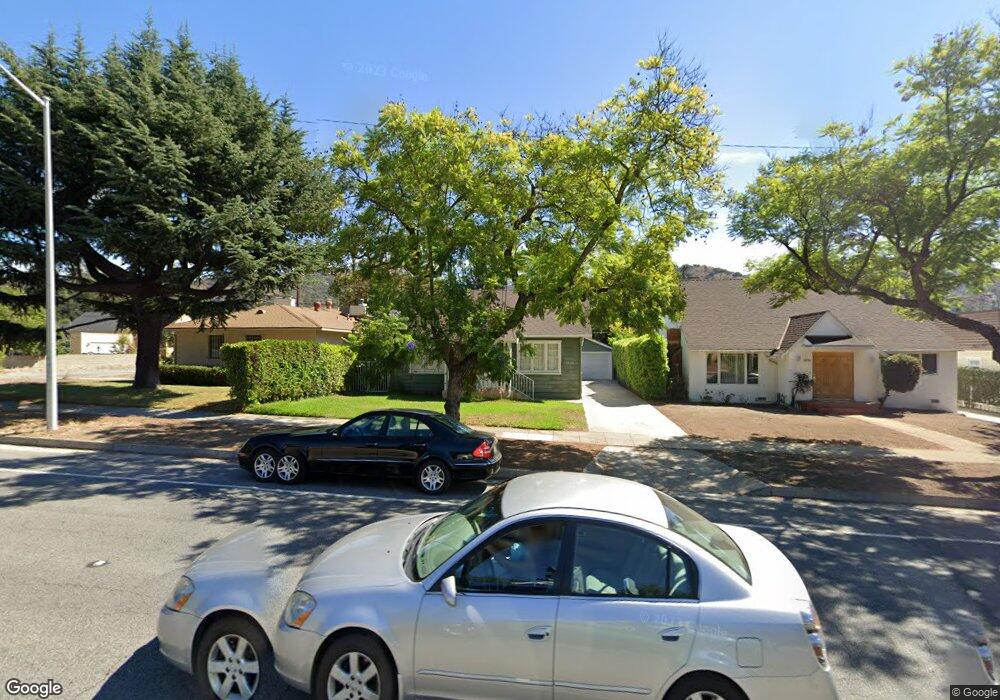
2830 Canada Blvd Glendale, CA 91208
Verdugo Woodlands NeighborhoodEstimated Value: $910,083 - $1,121,000
2
Beds
1
Bath
960
Sq Ft
$1,021/Sq Ft
Est. Value
About This Home
This home is located at 2830 Canada Blvd, Glendale, CA 91208 and is currently estimated at $979,771, approximately $1,020 per square foot. 2830 Canada Blvd is a home located in Los Angeles County with nearby schools including Verdugo Woodlands Elementary School, Woodrow Wilson Middle School, and Glendale High School.
Ownership History
Date
Name
Owned For
Owner Type
Purchase Details
Closed on
Jul 25, 2006
Sold by
Aivazian Alex
Bought by
Aivazian Alex and Alex Aivazian Living Trust
Current Estimated Value
Purchase Details
Closed on
Mar 14, 2003
Sold by
Goodman George C
Bought by
Alvazian Alex
Home Financials for this Owner
Home Financials are based on the most recent Mortgage that was taken out on this home.
Original Mortgage
$224,000
Outstanding Balance
$95,664
Interest Rate
5.79%
Estimated Equity
$884,107
Purchase Details
Closed on
Jun 22, 2000
Sold by
Goodman George C
Bought by
Goodman George C and The George C Goodman Trust
Purchase Details
Closed on
Nov 4, 1993
Sold by
Goodman George C
Bought by
Goodman George C
Home Financials for this Owner
Home Financials are based on the most recent Mortgage that was taken out on this home.
Original Mortgage
$140,250
Interest Rate
6.85%
Create a Home Valuation Report for This Property
The Home Valuation Report is an in-depth analysis detailing your home's value as well as a comparison with similar homes in the area
Home Values in the Area
Average Home Value in this Area
Purchase History
| Date | Buyer | Sale Price | Title Company |
|---|---|---|---|
| Aivazian Alex | -- | None Available | |
| Alvazian Alex | $280,000 | Stewart Title | |
| Goodman George C | -- | -- | |
| Goodman George C | -- | Stewart Title |
Source: Public Records
Mortgage History
| Date | Status | Borrower | Loan Amount |
|---|---|---|---|
| Open | Alvazian Alex | $224,000 | |
| Previous Owner | Goodman George C | $140,250 |
Source: Public Records
Tax History
| Year | Tax Paid | Tax Assessment Tax Assessment Total Assessment is a certain percentage of the fair market value that is determined by local assessors to be the total taxable value of land and additions on the property. | Land | Improvement |
|---|---|---|---|---|
| 2025 | $4,535 | $405,508 | $324,415 | $81,093 |
| 2024 | $4,535 | $397,557 | $318,054 | $79,503 |
| 2023 | $4,435 | $389,763 | $311,818 | $77,945 |
| 2022 | $4,357 | $382,121 | $305,704 | $76,417 |
| 2021 | $4,283 | $374,629 | $299,710 | $74,919 |
| 2019 | $4,122 | $363,519 | $290,821 | $72,698 |
| 2018 | $3,987 | $356,392 | $285,119 | $71,273 |
| 2016 | $3,802 | $342,555 | $274,049 | $68,506 |
| 2015 | $3,725 | $337,410 | $269,933 | $67,477 |
| 2014 | $3,699 | $330,802 | $264,646 | $66,156 |
Source: Public Records
Map
Nearby Homes
- 1724 Sombra Dr
- 1 Pasa Glen Dr
- 2940 N Verdugo Rd Unit 305
- 182 Emburns Dr
- 192 Emburns Dr
- 2 Emburns Dr
- 2950 Oak Glen Rd
- 0 Bayberry Dr Unit 25567317
- 1881 Alpha Rd Unit 17
- 1765 Fern Ln
- 2460 Las Positas Rd
- 1935 Alpha Rd Unit 337
- 1918 Calafia St
- 2020 Bonita Dr
- 2 Vista Del Verde Dr
- 6 Vista Del Verde Dr
- 2 Pasa Glen Dr
- 3 Vista Del Verde Dr
- 4 Vista Del Verde Dr
- 3226 Menlo Dr
- 2826 Canada Blvd
- 2834 Canada Blvd
- 2822 Canada Blvd
- 1714 Santa Paula Place
- 1711 Glorietta Ave
- 2820 Canada Blvd
- 2842 Canada Blvd
- 1718 Santa Paula Place
- 1720 Santa Paula Place
- 1711 Santa Paula Place
- 1719 Glorietta Ave
- 2850 Canada Blvd
- 1715 Santa Paula Place
- 2835 Canada Blvd
- 2825 Canada Blvd
- 2839 Canada Blvd
- 1717 Santa Paula Place
- 2821 Canada Blvd
- 2843 Canada Blvd
- 1706 Glorietta Ave
Your Personal Tour Guide
Ask me questions while you tour the home.