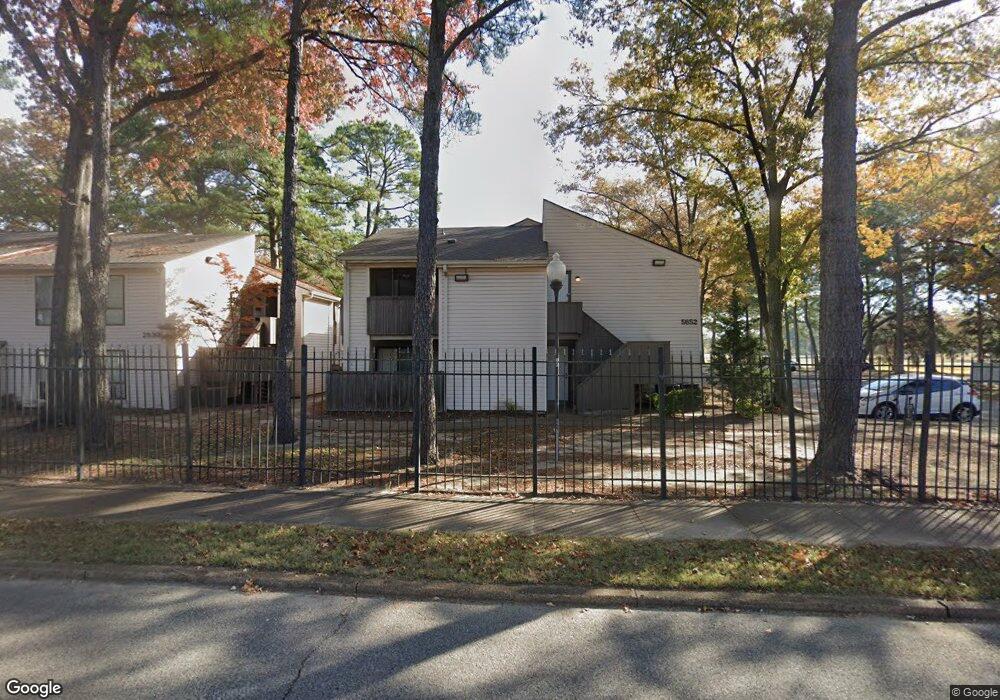
2830 Clarke Rd Unit 54D Memphis, TN 38115
Fox Meadows NeighborhoodEstimated Value: $37,000 - $70,000
2
Beds
2
Baths
960
Sq Ft
$53/Sq Ft
Est. Value
About This Home
This home is located at 2830 Clarke Rd Unit 54D, Memphis, TN 38115 and is currently estimated at $50,853, approximately $52 per square foot. 2830 Clarke Rd Unit 54D is a home located in Shelby County with nearby schools including Fox Meadows Elementary School, Wooddale High School, and Cornerstone Prep School.
Ownership History
Date
Name
Owned For
Owner Type
Purchase Details
Closed on
Jul 17, 2025
Sold by
Hamlets Inc
Bought by
Ctn Enterprises Inc
Current Estimated Value
Purchase Details
Closed on
Oct 18, 2024
Sold by
Hamlets Inc
Bought by
Hamlets Inc
Purchase Details
Closed on
Jul 20, 2023
Sold by
Shelby County Chancery Court
Bought by
Vinson Gloria
Purchase Details
Closed on
May 28, 2014
Sold by
Chism Sidney
Bought by
Vinson Gloria
Home Financials for this Owner
Home Financials are based on the most recent Mortgage that was taken out on this home.
Original Mortgage
$25,000
Interest Rate
4.36%
Mortgage Type
New Conventional
Purchase Details
Closed on
Aug 14, 2007
Sold by
Harmon Dahra Sonia
Bought by
Hud
Purchase Details
Closed on
Dec 5, 1996
Sold by
Tennessee Housing Development Agency
Bought by
Hud
Purchase Details
Closed on
Dec 3, 1996
Sold by
Erickson Daniel D
Bought by
Tennessee Housing Development Agency
Create a Home Valuation Report for This Property
The Home Valuation Report is an in-depth analysis detailing your home's value as well as a comparison with similar homes in the area
Home Values in the Area
Average Home Value in this Area
Purchase History
| Date | Buyer | Sale Price | Title Company |
|---|---|---|---|
| Ctn Enterprises Inc | $19,500 | None Listed On Document | |
| Hamlets Inc | $33,413 | None Listed On Document | |
| Vinson Gloria | $25,900 | None Listed On Document | |
| Vinson Gloria | $25,000 | None Available | |
| Hud | $33,348 | None Available | |
| Hud | -- | -- | |
| Hud | -- | -- | |
| Tennessee Housing Development Agency | $39,531 | -- | |
| Tennessee Housing Development Agency | $39,531 | -- |
Source: Public Records
Mortgage History
| Date | Status | Borrower | Loan Amount |
|---|---|---|---|
| Previous Owner | Vinson Gloria | $25,000 |
Source: Public Records
Tax History Compared to Growth
Tax History
| Year | Tax Paid | Tax Assessment Tax Assessment Total Assessment is a certain percentage of the fair market value that is determined by local assessors to be the total taxable value of land and additions on the property. | Land | Improvement |
|---|---|---|---|---|
| 2025 | $177 | $9,275 | $950 | $8,325 |
| 2024 | $172 | $6,375 | $950 | $5,425 |
| 2023 | $172 | $6,375 | $950 | $5,425 |
| 2022 | $388 | $6,375 | $950 | $5,425 |
| 2021 | $393 | $6,375 | $950 | $5,425 |
| 2020 | $344 | $4,750 | $950 | $3,800 |
| 2019 | $344 | $4,750 | $950 | $3,800 |
| 2018 | $344 | $4,750 | $950 | $3,800 |
| 2017 | $195 | $4,750 | $950 | $3,800 |
| 2016 | $353 | $8,075 | $0 | $0 |
| 2014 | $353 | $8,075 | $0 | $0 |
Source: Public Records
Map
Nearby Homes
- 2829 Los Gatos Ct Unit 1
- 2833 Los Gatos Ct Unit 1
- 2817 Sonora Dr Unit 124
- 5577 Gates Cove Unit 47
- 5599 Fox Meadows Cove
- 3054 Inverness Parkway Dr
- 2849 S Mendenhall Rd
- 3016 Egan Dr
- 5531 Knight Arnold Rd
- 6010 Fox Ridge Dr
- 3257 Clarke Rd
- 3172 Tulip Poplar Dr Unit 30
- 3169 Flowering Cherry Ln Unit 46
- 5700 Chapman Ave
- 3218 13 Colony Mall
- 3212 Thirteen Colony Mall Unit 3A
- 5995 Lofty Oak Rd
- 3243 Thirteen Colony Mall Unit 2B
- 3187 Belle Tower Rd
- 5821 Baird Dr
- 2830 Clarke Rd Unit 2
- 2830 Clarke Rd
- 2826 Clarke Rd Unit 4
- 2826 Clarke Rd Unit 2
- 2826 Clarke Rd Unit 3
- 2826 Clarke Rd Unit 1
- 2826 Clarke Rd
- 2826 Clarke Rd Unit 52D
- 2826 Clarke Rd
- 2826 Clarke Rd Unit 53D
- 5652 Los Gatos Dr Unit 1
- 5652 Los Gatos Dr Unit 2
- 5652 Los Gatos Dr
- 5652 Los Gatos Dr Unit 55D
- 5654 Los Gatos Dr Unit 2
- 5654 Los Gatos Dr Unit 4
- 5654 Los Gatos Dr Unit 1
- 5654 Los Gatos Dr
- 5654 Los Gatos Dr Unit 56U
- 5654 Los Gatos Dr