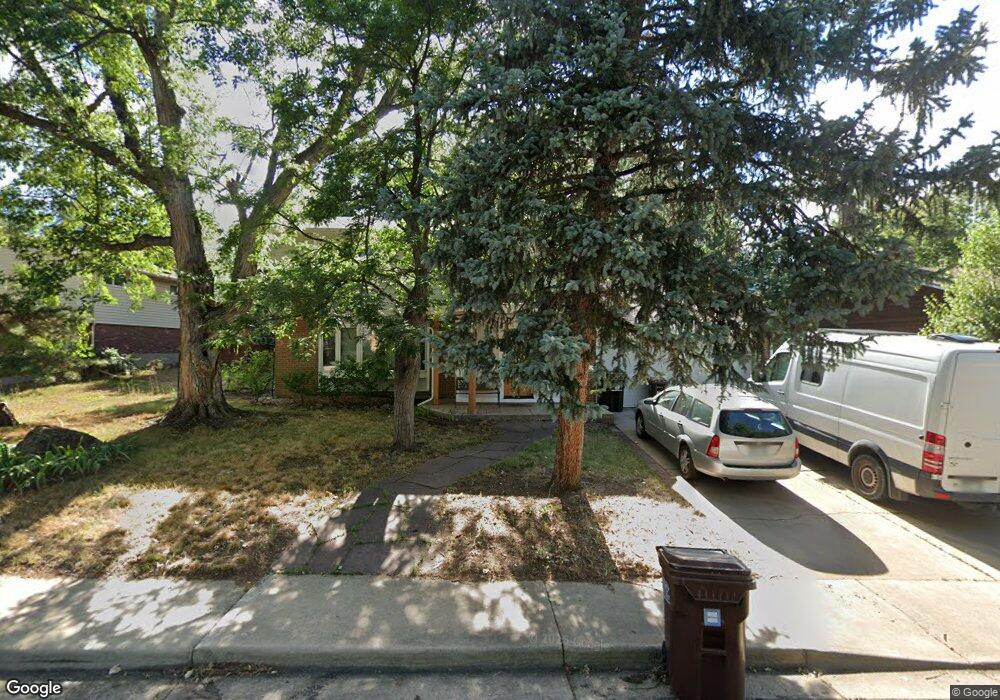
2830 Colby Dr Boulder, CO 80305
Table Mesa NeighborhoodEstimated Value: $1,404,000 - $1,585,000
4
Beds
3
Baths
2,058
Sq Ft
$717/Sq Ft
Est. Value
About This Home
This home is located at 2830 Colby Dr, Boulder, CO 80305 and is currently estimated at $1,475,767, approximately $717 per square foot. 2830 Colby Dr is a home located in Boulder County with nearby schools including Bear Creek Elementary School, Southern Hills Middle School, and Fairview High School.
Ownership History
Date
Name
Owned For
Owner Type
Purchase Details
Closed on
May 18, 2017
Sold by
Blum Alex and Blum Varda
Bought by
Blum Alex
Current Estimated Value
Purchase Details
Closed on
Aug 22, 2002
Sold by
Blum Alex and Blum Varda
Bought by
Blum Alex and Blum Varda
Purchase Details
Closed on
Jan 31, 1995
Sold by
Doyle Rebecca Lynn and Doyle John Dennis
Bought by
Blum Alex
Home Financials for this Owner
Home Financials are based on the most recent Mortgage that was taken out on this home.
Original Mortgage
$160,000
Interest Rate
9.13%
Purchase Details
Closed on
Jul 30, 1987
Bought by
Blum Alex and Blum Varda
Purchase Details
Closed on
Jul 22, 1975
Bought by
Blum Alex and Blum Varda
Create a Home Valuation Report for This Property
The Home Valuation Report is an in-depth analysis detailing your home's value as well as a comparison with similar homes in the area
Home Values in the Area
Average Home Value in this Area
Purchase History
| Date | Buyer | Sale Price | Title Company |
|---|---|---|---|
| Blum Alex | -- | None Available | |
| Blum Alex | -- | -- | |
| Blum Alex | $260,000 | Commonwealth Land Title | |
| Blum Alex | $130,000 | -- | |
| Blum Alex | $50,000 | -- |
Source: Public Records
Mortgage History
| Date | Status | Borrower | Loan Amount |
|---|---|---|---|
| Closed | Blum Alex | $160,000 |
Source: Public Records
Tax History
| Year | Tax Paid | Tax Assessment Tax Assessment Total Assessment is a certain percentage of the fair market value that is determined by local assessors to be the total taxable value of land and additions on the property. | Land | Improvement |
|---|---|---|---|---|
| 2025 | $7,698 | $87,125 | $56,544 | $30,581 |
| 2024 | $7,698 | $87,125 | $56,544 | $30,581 |
| 2023 | $7,564 | $94,289 | $64,890 | $33,085 |
| 2022 | $6,924 | $74,560 | $47,733 | $26,827 |
| 2021 | $6,602 | $76,705 | $49,106 | $27,599 |
| 2020 | $5,835 | $67,031 | $45,188 | $21,843 |
| 2019 | $5,745 | $67,031 | $45,188 | $21,843 |
| 2018 | $5,578 | $64,339 | $31,896 | $32,443 |
| 2017 | $5,404 | $71,131 | $35,263 | $35,868 |
| 2016 | $4,795 | $55,394 | $25,711 | $29,683 |
| 2015 | $4,541 | $48,245 | $21,810 | $26,435 |
| 2014 | $4,056 | $48,245 | $21,810 | $26,435 |
Source: Public Records
Map
Nearby Homes
- 2860 Table Mesa Dr
- 3210 Emerson Ave
- 2235 Vassar Dr
- 2955 Stanford Ave
- 3450 Emerson Ave
- 3490 Emerson Ave
- 2585 Kohler Dr
- 3000 Dartmouth Ave
- 1740 Bear Mountain Dr
- 2665 Juilliard St
- 1965 Kohler Dr
- 345 S 38th St
- 1865 Kohler Dr
- 4445 Grinnell Ave
- 450 S 41st St
- 2596 Briarwood Dr
- 4380 Ludlow St
- 4445 Squires Cir
- 725 S 45th St
- 210 S 39th St
Your Personal Tour Guide
Ask me questions while you tour the home.