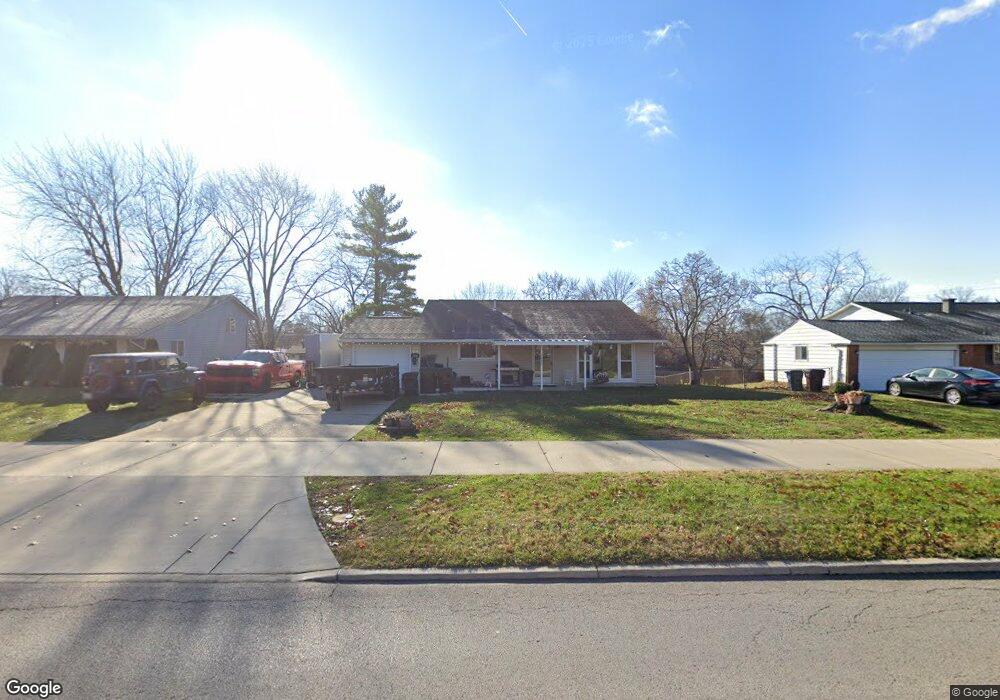
2830 E Stroop Rd Kettering, OH 45440
Estimated Value: $241,000 - $273,000
3
Beds
2
Baths
1,710
Sq Ft
$153/Sq Ft
Est. Value
About This Home
This home is located at 2830 E Stroop Rd, Kettering, OH 45440 and is currently estimated at $262,208, approximately $153 per square foot. 2830 E Stroop Rd is a home located in Montgomery County with nearby schools including Prass Elementary School, Kettering Middle School, and Kettering Fairmont High School.
Ownership History
Date
Name
Owned For
Owner Type
Purchase Details
Closed on
Mar 27, 2020
Sold by
Carbino Timothy J and Balakrishnan Gita
Bought by
Forsthoefel Timothy J and Forsthoefel Rachael
Current Estimated Value
Home Financials for this Owner
Home Financials are based on the most recent Mortgage that was taken out on this home.
Original Mortgage
$159,310
Outstanding Balance
$142,496
Interest Rate
4.37%
Mortgage Type
FHA
Estimated Equity
$119,712
Purchase Details
Closed on
Jan 25, 2008
Sold by
Norrod Gregory K and Norrod Paula L
Bought by
Carbino Timothy J
Home Financials for this Owner
Home Financials are based on the most recent Mortgage that was taken out on this home.
Original Mortgage
$120,650
Interest Rate
6.2%
Mortgage Type
Purchase Money Mortgage
Purchase Details
Closed on
Mar 13, 1995
Sold by
Keene Johnny E and Keene Vicki G
Bought by
Norrod Gregory K and Norrod Paula L
Create a Home Valuation Report for This Property
The Home Valuation Report is an in-depth analysis detailing your home's value as well as a comparison with similar homes in the area
Home Values in the Area
Average Home Value in this Area
Purchase History
| Date | Buyer | Sale Price | Title Company |
|---|---|---|---|
| Forsthoefel Timothy J | $162,300 | Landmark Ttl Agcy South Inc | |
| Carbino Timothy J | $127,000 | Attorney | |
| Norrod Gregory K | -- | -- |
Source: Public Records
Mortgage History
| Date | Status | Borrower | Loan Amount |
|---|---|---|---|
| Open | Forsthoefel Timothy J | $159,310 | |
| Previous Owner | Carbino Timothy J | $120,650 |
Source: Public Records
Tax History
| Year | Tax Paid | Tax Assessment Tax Assessment Total Assessment is a certain percentage of the fair market value that is determined by local assessors to be the total taxable value of land and additions on the property. | Land | Improvement |
|---|---|---|---|---|
| 2025 | $4,198 | $65,570 | $12,520 | $53,050 |
| 2024 | $4,079 | $65,570 | $12,520 | $53,050 |
| 2023 | $4,079 | $65,570 | $12,520 | $53,050 |
| 2022 | $4,112 | $52,280 | $10,020 | $42,260 |
| 2021 | $3,889 | $52,280 | $10,020 | $42,260 |
| 2020 | $3,815 | $52,280 | $10,020 | $42,260 |
| 2019 | $3,608 | $42,730 | $10,020 | $32,710 |
| 2018 | $3,627 | $42,730 | $10,020 | $32,710 |
| 2017 | $3,350 | $42,730 | $10,020 | $32,710 |
| 2016 | $3,031 | $37,200 | $10,020 | $27,180 |
| 2015 | $2,896 | $37,200 | $10,020 | $27,180 |
| 2014 | $2,896 | $37,200 | $10,020 | $27,180 |
| 2012 | -- | $39,800 | $10,000 | $29,800 |
Source: Public Records
Map
Nearby Homes
- 4086 Glenheath Dr
- 2716 Hemphill Rd
- 2776 Corlington Dr
- 3170 E Stroop Rd Unit 103
- 4485 Sentry Hill Ct
- 2364 Hemphill Rd
- 2816 Corlington Dr
- 4408 Glenheath Dr
- 430 Craftsbury Ct
- 4426 Woodbank Dr
- 3041 Revlon Dr
- 2197 Bending Willow Dr
- 4351 Sillman Place
- 3313 Braddock St
- 4524 Drayton Ct
- 4416 Timberwilde Dr
- 3167 Gracemore Ave
- 2648 Parklawn Dr
- 4190 Woodman Dr
- 861 Acorn Dr
- 2800 E Stroop Rd
- 2860 E Stroop Rd
- 4010 Brazoria Place
- 2780 E Stroop Rd
- 2890 E Stroop Rd
- 4017 Brazoria Place
- 4018 Brazoria Place
- 2750 E Stroop Rd
- 2900 E Stroop Rd
- 4025 Brazoria Place
- 4018 Weybright Ct
- 4026 Brazoria Place
- 2730 E Stroop Rd
- 2930 E Stroop Rd
- 4026 Weybright Ct
- 4033 Brazoria Place
- 4009 Wagner Rd
- 2801 Santa Rosa Dr
- 4010 Weybright Ct
- 2841 Santa Rosa Dr
Your Personal Tour Guide
Ask me questions while you tour the home.