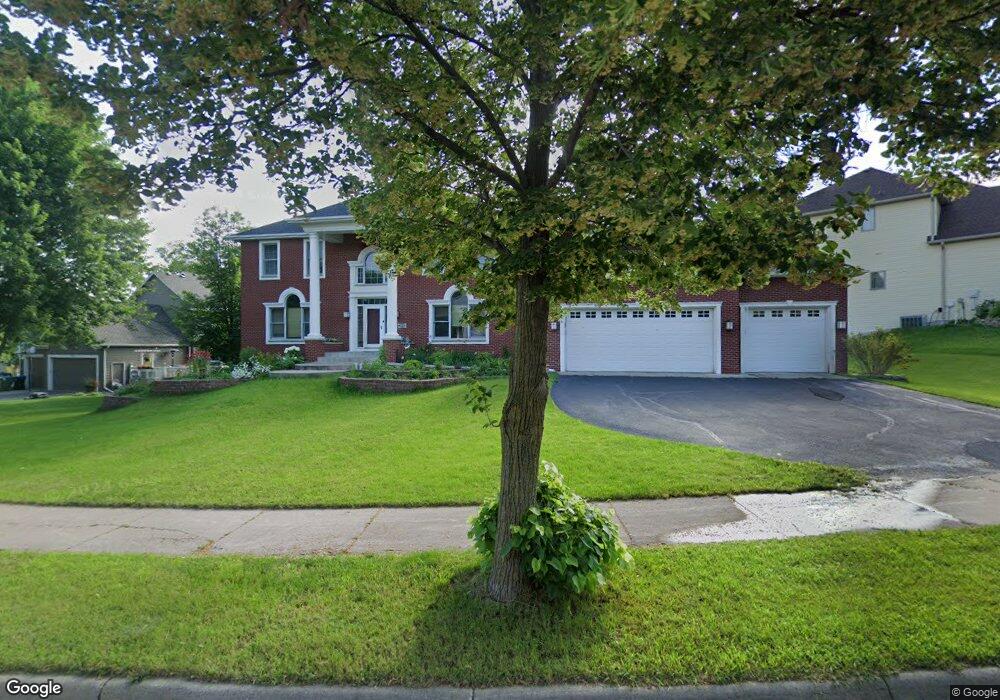
2830 Hillscourte S Saint Paul, MN 55113
South Owasso NeighborhoodEstimated Value: $825,000 - $946,000
6
Beds
5
Baths
3,520
Sq Ft
$252/Sq Ft
Est. Value
About This Home
This home is located at 2830 Hillscourte S, Saint Paul, MN 55113 and is currently estimated at $887,355, approximately $252 per square foot. 2830 Hillscourte S is a home located in Ramsey County with nearby schools including Central Park Elementary School, Roseville Area Middle School, and Roseville Area Senior High School.
Ownership History
Date
Name
Owned For
Owner Type
Purchase Details
Closed on
Jun 9, 2017
Sold by
Property Buyers R Us Llc
Bought by
Zhao Julia Q and Wang Jintu J
Current Estimated Value
Home Financials for this Owner
Home Financials are based on the most recent Mortgage that was taken out on this home.
Original Mortgage
$4,109,600
Outstanding Balance
$2,156,243
Interest Rate
4.02%
Mortgage Type
New Conventional
Estimated Equity
-$1,268,888
Purchase Details
Closed on
May 6, 2016
Sold by
Polla Dennis Lee and Chan Jolene Teresa
Bought by
Property Buyers R Us Llc
Home Financials for this Owner
Home Financials are based on the most recent Mortgage that was taken out on this home.
Original Mortgage
$317,600
Interest Rate
3.59%
Mortgage Type
Unknown
Purchase Details
Closed on
Sep 14, 1998
Sold by
Independent School District #623
Bought by
Legran Homes Corp
Create a Home Valuation Report for This Property
The Home Valuation Report is an in-depth analysis detailing your home's value as well as a comparison with similar homes in the area
Home Values in the Area
Average Home Value in this Area
Purchase History
| Date | Buyer | Sale Price | Title Company |
|---|---|---|---|
| Zhao Julia Q | $540,394 | Gibraltar Title Agency Llc | |
| Property Buyers R Us Llc | $397,000 | Gibraltar Title Agency Llc | |
| Legran Homes Corp | $497,500 | -- |
Source: Public Records
Mortgage History
| Date | Status | Borrower | Loan Amount |
|---|---|---|---|
| Open | Zhao Julia Q | $4,109,600 | |
| Previous Owner | Property Buyers R Us Llc | $317,600 |
Source: Public Records
Tax History Compared to Growth
Tax History
| Year | Tax Paid | Tax Assessment Tax Assessment Total Assessment is a certain percentage of the fair market value that is determined by local assessors to be the total taxable value of land and additions on the property. | Land | Improvement |
|---|---|---|---|---|
| 2025 | $12,208 | $891,600 | $126,000 | $765,600 |
| 2023 | $12,208 | $800,200 | $115,500 | $684,700 |
| 2022 | $11,572 | $768,100 | $115,500 | $652,600 |
| 2021 | $10,680 | $719,100 | $115,500 | $603,600 |
| 2020 | $10,194 | $707,100 | $99,800 | $607,300 |
| 2019 | $9,570 | $641,800 | $95,000 | $546,800 |
| 2018 | $11,024 | $594,000 | $94,700 | $499,300 |
| 2017 | $8,058 | $643,000 | $90,000 | $553,000 |
| 2016 | $10,470 | $0 | $0 | $0 |
| 2015 | $10,272 | $651,100 | $130,100 | $521,000 |
| 2014 | $10,918 | $0 | $0 | $0 |
Source: Public Records
Map
Nearby Homes
- 2748 Kent St
- 613 S Owasso Blvd W
- 540 Woodhill Dr Unit 71
- 405 Judith Ave
- 2720 MacKubin St
- 2730 Dale St N Unit D101
- 2730 Dale St N Unit D309
- 387 Iona Ln
- 2720 Dale St N Unit C208
- 2710 Dale St N Unit B212
- 437 County Road C W
- 556 County Road C W
- 667 County Road C W
- 2970 Western Ave N
- 2814 Matilda St
- 350 County Road C W
- 2580 Western Ave N
- 2687 Galtier St
- 255 County Road C2 W
- 2802 Marion St
- 2820 Hillscourte S
- 2840 Hillscourte S
- 542 Owasso Hills Dr
- 2810 Hillscourte S
- 2835 Hillscourte S
- 2829 Hillscourte S
- 2841 Hillscourte S
- 538 Owasso Hills Dr
- 554 Owasso Hills Dr
- 2823 Hillscourte S
- 2819 Hillscourte S
- 2815 Hillscourte S
- 0 Unassigned
- 2800 Hillscourte S
- 551 Owasso Hills Dr
- 569 Terrace Courte
- 573 Terrace Courte
- 568 Terrace Courte
- 539 Owasso Hills Dr
- 564 Owasso Hills Dr