28301 Cumberland Rd Tehachapi, CA 93561
Estimated Value: $351,000 - $476,367
4
Beds
2
Baths
2,225
Sq Ft
$194/Sq Ft
Est. Value
About This Home
This home is located at 28301 Cumberland Rd, Tehachapi, CA 93561 and is currently estimated at $431,842, approximately $194 per square foot. 28301 Cumberland Rd is a home located in Kern County with nearby schools including Cummings Valley Elementary School, Jacobsen Middle School, and Tehachapi High School.
Ownership History
Date
Name
Owned For
Owner Type
Purchase Details
Closed on
Dec 6, 2010
Sold by
Aitelli Ernest C and Aitelli Phyllis
Bought by
Aitelli Ernest C
Current Estimated Value
Home Financials for this Owner
Home Financials are based on the most recent Mortgage that was taken out on this home.
Original Mortgage
$177,800
Outstanding Balance
$117,230
Interest Rate
4.18%
Estimated Equity
$314,612
Purchase Details
Closed on
Jan 11, 2001
Sold by
Aitelli Ernest C and Aitelli Phyllis
Bought by
Aitelli Ernest C and Aitelli Phyllis
Create a Home Valuation Report for This Property
The Home Valuation Report is an in-depth analysis detailing your home's value as well as a comparison with similar homes in the area
Home Values in the Area
Average Home Value in this Area
Purchase History
| Date | Buyer | Sale Price | Title Company |
|---|---|---|---|
| Aitelli Ernest C | -- | First American Title Company | |
| Aitelli Ernest C | -- | First American Title Company | |
| Aitelli Ernest C | -- | -- |
Source: Public Records
Mortgage History
| Date | Status | Borrower | Loan Amount |
|---|---|---|---|
| Open | Aitelli Ernest C | $177,800 |
Source: Public Records
Tax History
| Year | Tax Paid | Tax Assessment Tax Assessment Total Assessment is a certain percentage of the fair market value that is determined by local assessors to be the total taxable value of land and additions on the property. | Land | Improvement |
|---|---|---|---|---|
| 2025 | $1,933 | $116,824 | $27,788 | $89,036 |
| 2024 | $1,880 | $114,535 | $27,244 | $87,291 |
| 2023 | $1,880 | $112,290 | $26,710 | $85,580 |
| 2022 | $1,859 | $110,089 | $26,187 | $83,902 |
| 2021 | $1,803 | $107,931 | $25,674 | $82,257 |
| 2020 | $1,794 | $106,825 | $25,411 | $81,414 |
| 2019 | $1,791 | $106,825 | $25,411 | $81,414 |
| 2018 | $1,747 | $102,678 | $24,425 | $78,253 |
| 2017 | $1,745 | $100,666 | $23,947 | $76,719 |
| 2016 | $1,711 | $98,693 | $23,478 | $75,215 |
| 2015 | $1,722 | $97,212 | $23,126 | $74,086 |
| 2014 | $1,753 | $95,308 | $22,673 | $72,635 |
Source: Public Records
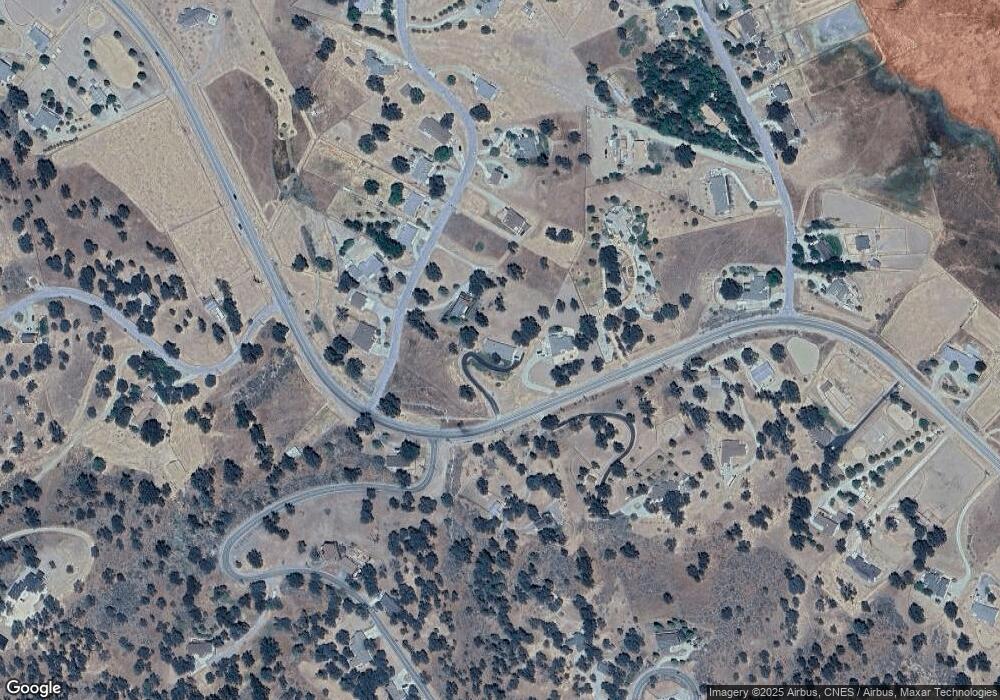
Map
Nearby Homes
- 28221 Cumberland Rd
- 23250 Dart Dr
- 0 Ridgeview
- 28600 Ridgeview Ct
- 23320 Dart Dr
- 23441 Lakeview Dr
- 0 Cumberland Unit 9984468
- 0 Cumberland Unit 9993625
- 22481 Saddleback Dr
- 0 Lakeview Dr
- 22401 Saddleback Dr
- 23600 Dart Dr
- 23740 Lakeview Dr
- 23841 Dart Dr
- 0 San Juan Dr
- 23901 Lakeview Dr
- 0 Skyline Dr Unit 9990016
- 0 Skyline Dr Unit 25885685
- 0 Skyline Dr Unit 9992737
- 0 Vl 313-262-06 Unit 25006695
- 28251 Cumberland Rd
- 23040 Lakeview Dr
- 23100 Lakeview Dr
- 28400 Cumberland Rd
- 23041 Lakeview Dr
- 23140 Lakeview Dr
- 28300 Cumberland Rd
- 23101 Lakeview Dr
- 23150 Lakeview Dr
- 28250 Cumberland Rd
- 23151 Lakeview Dr
- 23151 Lakeview Dr
- 23101 Dart Dr
- 28200 Cumberland Rd
- 23160 Lakeview Dr
- 23001 Dart Dr
- 23081 Dart Dr
- 22900 Saddleback Dr
- 22860 Saddleback Dr
- 22770 Saddleback Dr
Your Personal Tour Guide
Ask me questions while you tour the home.