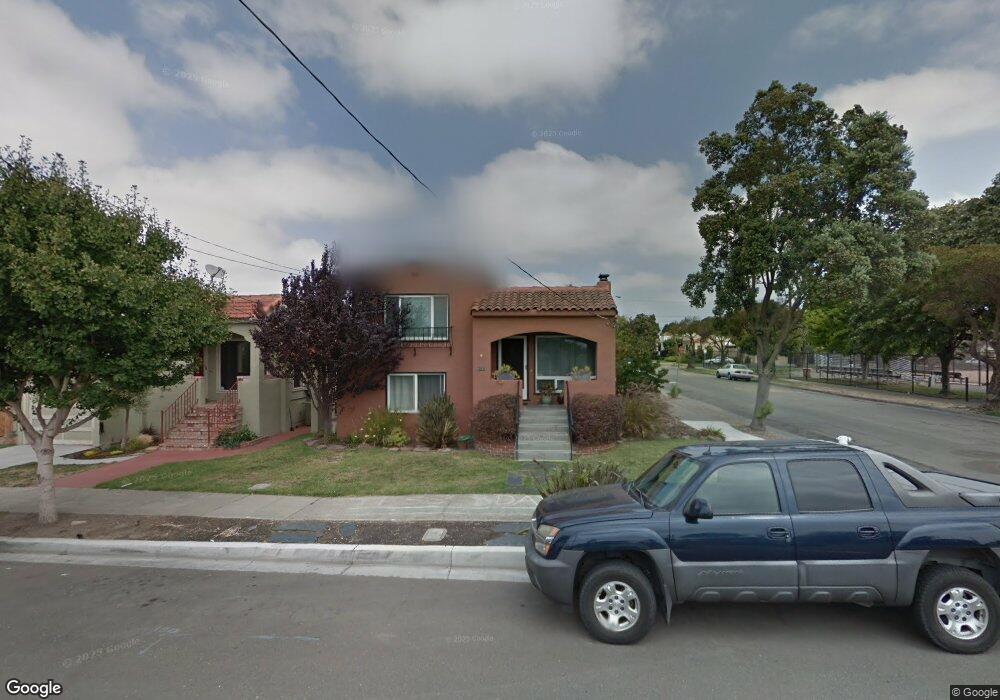
2831 Clay St Alameda, CA 94501
South Shore NeighborhoodEstimated Value: $1,114,000 - $1,280,000
3
Beds
2
Baths
1,520
Sq Ft
$784/Sq Ft
Est. Value
About This Home
This home is located at 2831 Clay St, Alameda, CA 94501 and is currently estimated at $1,191,649, approximately $783 per square foot. 2831 Clay St is a home located in Alameda County with nearby schools including Frank Otis Elementary School, Lincoln Middle School, and Alameda High School.
Ownership History
Date
Name
Owned For
Owner Type
Purchase Details
Closed on
Dec 30, 2025
Sold by
Rogers Michael L and Rogers Heather A
Bought by
Rogers Living Trust and Rogers
Current Estimated Value
Purchase Details
Closed on
Apr 30, 1998
Sold by
Blomberg Burton B and Blomberg Robert M
Bought by
Rogers Michael L and Rogers Heather A
Home Financials for this Owner
Home Financials are based on the most recent Mortgage that was taken out on this home.
Original Mortgage
$210,500
Interest Rate
7.05%
Purchase Details
Closed on
Aug 28, 1997
Sold by
Blomberg Irene Revocable Trust and Burton B
Bought by
Blomberg Burton B and Blomberg Robert H
Create a Home Valuation Report for This Property
The Home Valuation Report is an in-depth analysis detailing your home's value as well as a comparison with similar homes in the area
Home Values in the Area
Average Home Value in this Area
Purchase History
| Date | Buyer | Sale Price | Title Company |
|---|---|---|---|
| Rogers Living Trust | -- | None Listed On Document | |
| Rogers Michael L | $263,500 | First American Title Guarant | |
| Blomberg Burton B | -- | -- |
Source: Public Records
Mortgage History
| Date | Status | Borrower | Loan Amount |
|---|---|---|---|
| Previous Owner | Rogers Michael L | $210,500 |
Source: Public Records
Tax History
| Year | Tax Paid | Tax Assessment Tax Assessment Total Assessment is a certain percentage of the fair market value that is determined by local assessors to be the total taxable value of land and additions on the property. | Land | Improvement |
|---|---|---|---|---|
| 2025 | $7,178 | $428,741 | $126,136 | $309,605 |
| 2024 | $7,178 | $420,199 | $123,664 | $303,535 |
| 2023 | $6,927 | $418,823 | $121,239 | $297,584 |
| 2022 | $6,780 | $403,612 | $118,862 | $291,750 |
| 2021 | $6,626 | $395,562 | $116,532 | $286,030 |
| 2020 | $6,548 | $398,435 | $115,337 | $283,098 |
| 2019 | $6,040 | $390,624 | $113,076 | $277,548 |
| 2018 | $5,896 | $382,966 | $110,859 | $272,107 |
| 2017 | $5,647 | $375,459 | $108,686 | $266,773 |
| 2016 | $5,642 | $368,098 | $106,555 | $261,543 |
| 2015 | $5,619 | $362,570 | $104,955 | $257,615 |
| 2014 | $5,385 | $355,468 | $102,899 | $252,569 |
Source: Public Records
Map
Nearby Homes
- 1211 Court St
- 1324 Grove St
- 1100 Park Ave
- 1321 Pearl St
- 954 Park St
- 976 Park St
- 3248 Briggs Ave
- 2959 Sea View Pkwy
- 1376 Versailles Ave
- 2608 Central Ave
- 2857 Sea View Pkwy
- 2312 San Antonio Ave
- 2417 Marti Rae Ct
- 405 Centre Ct
- 1251 Park St
- 3235 Central Ave
- 608 Centre Ct
- 137 Parfait Ln
- 641 Centre Ct
- 632 Centre Ct Unit 48
Your Personal Tour Guide
Ask me questions while you tour the home.