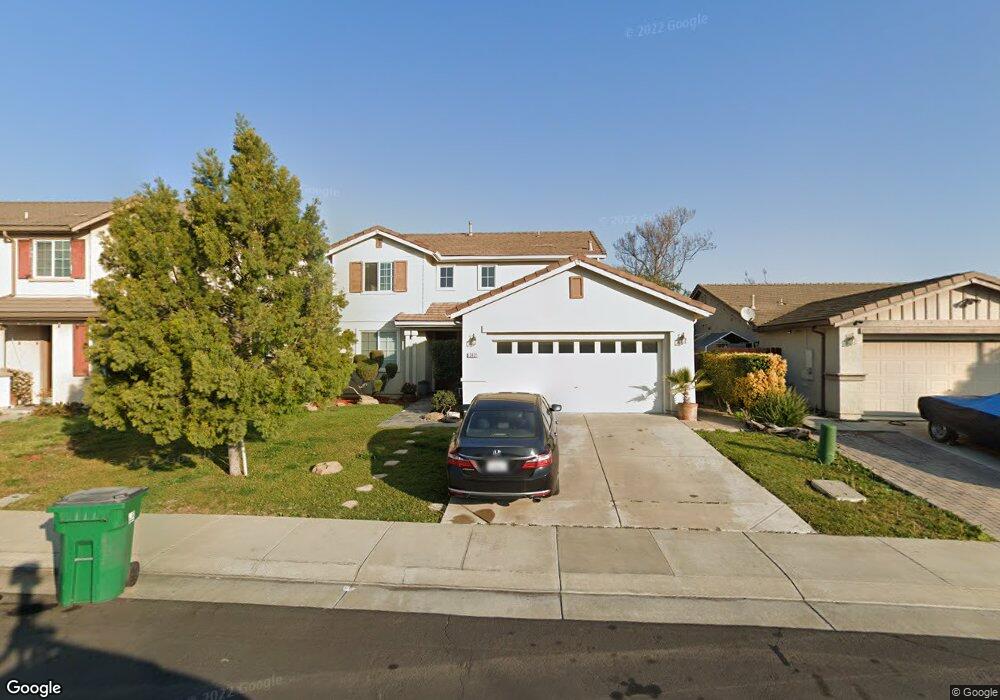
2831 Keyser Dr Stockton, CA 95212
Valley Oak NeighborhoodEstimated Value: $430,000 - $510,904
4
Beds
3
Baths
1,969
Sq Ft
$244/Sq Ft
Est. Value
About This Home
This home is located at 2831 Keyser Dr, Stockton, CA 95212 and is currently estimated at $479,726, approximately $243 per square foot. 2831 Keyser Dr is a home located in San Joaquin County with nearby schools including George W. Bush Elementary School, Valentine Peyton Elementary School, and Rio Calaveras Elementary School.
Ownership History
Date
Name
Owned For
Owner Type
Purchase Details
Closed on
May 28, 2019
Sold by
Zuluaga Hernan D
Bought by
Fuentes Zuluaga Hernan Dario and Fuentes Villalba Maria Marleny
Current Estimated Value
Purchase Details
Closed on
Aug 16, 2005
Sold by
Zuluaga Hernan D
Bought by
Zuluaga Hernan D and Fuentes Maria Marleny
Home Financials for this Owner
Home Financials are based on the most recent Mortgage that was taken out on this home.
Original Mortgage
$343,000
Outstanding Balance
$179,603
Interest Rate
5.61%
Mortgage Type
New Conventional
Estimated Equity
$300,123
Purchase Details
Closed on
Feb 11, 2004
Sold by
Kb Home North Bay Inc
Bought by
Zuluaga Hernan D
Home Financials for this Owner
Home Financials are based on the most recent Mortgage that was taken out on this home.
Original Mortgage
$225,600
Interest Rate
5.5%
Mortgage Type
Purchase Money Mortgage
Create a Home Valuation Report for This Property
The Home Valuation Report is an in-depth analysis detailing your home's value as well as a comparison with similar homes in the area
Home Values in the Area
Average Home Value in this Area
Purchase History
| Date | Buyer | Sale Price | Title Company |
|---|---|---|---|
| Fuentes Zuluaga Hernan Dario | -- | None Available | |
| Zuluaga Hernan D | -- | Fidelity Natl Title Ins Co | |
| Zuluaga Hernan D | -- | Fidelity Natl Title Ins Co | |
| Zuluaga Hernan D | $283,500 | First Amer Title Co |
Source: Public Records
Mortgage History
| Date | Status | Borrower | Loan Amount |
|---|---|---|---|
| Open | Zuluaga Hernan D | $343,000 | |
| Closed | Zuluaga Hernan D | $225,600 | |
| Closed | Zuluaga Hernan D | $57,668 |
Source: Public Records
Tax History Compared to Growth
Tax History
| Year | Tax Paid | Tax Assessment Tax Assessment Total Assessment is a certain percentage of the fair market value that is determined by local assessors to be the total taxable value of land and additions on the property. | Land | Improvement |
|---|---|---|---|---|
| 2025 | $5,737 | $402,726 | $119,423 | $283,303 |
| 2024 | $5,608 | $394,831 | $117,082 | $277,749 |
| 2023 | $5,478 | $387,090 | $114,787 | $272,303 |
| 2022 | $5,396 | $379,501 | $112,537 | $266,964 |
| 2021 | $5,190 | $372,061 | $110,331 | $261,730 |
| 2020 | $5,287 | $368,247 | $109,200 | $259,047 |
| 2019 | $5,246 | $361,027 | $107,059 | $253,968 |
| 2018 | $5,160 | $353,949 | $104,960 | $248,989 |
| 2017 | $4,268 | $297,000 | $88,000 | $209,000 |
| 2016 | $4,217 | $274,000 | $81,000 | $193,000 |
| 2014 | $3,584 | $230,000 | $69,000 | $161,000 |
Source: Public Records
Map
Nearby Homes
- 6130 Fred Russo Dr
- 5718 Krissi Ct
- 6052 Saxton Ct
- 5813 Fred Russo Dr
- 2810 Auto Center Cir
- 5250 Foxglove Ct
- 5431 Strawberry Way
- 7028 Tristan Cir
- 7112 Tristan Cir
- 7127 Tristan Cir Unit 10
- 2709 Etcheverry Dr
- 2813 Etcheverry Dr
- 7238 Sharkon Ln
- 8007 Lorraine Ave
- 1926 Shameran St
- 2321 Bartram Run Way
- 1864 Caleb Cir
- 5831 Caribbean Cir
- 5100 N Highway 99 Unit 8
- 5100 N Highway 99 Unit 83
- 2819 Keyser Dr
- 2837 Keyser Dr
- 2815 Keyser Dr
- 2830 Sebastan Ln
- 2842 Sebastan Ln
- 5737 Rayanna Dr
- 5749 Rayanna Dr
- 2816 Sebastan Ln
- 2803 Keyser Dr
- 2832 Keyser Dr
- 5755 Rayanna Dr
- 2820 Keyser Dr
- 2838 Keyser Dr
- 2808 Sebastan Ln
- 2814 Keyser Dr
- 5763 Rayanna Dr
- 2775 Keyser Dr
- 2854 Sebastan Ln
- 2850 Keyser Dr
- 2746 Sebastan Ln