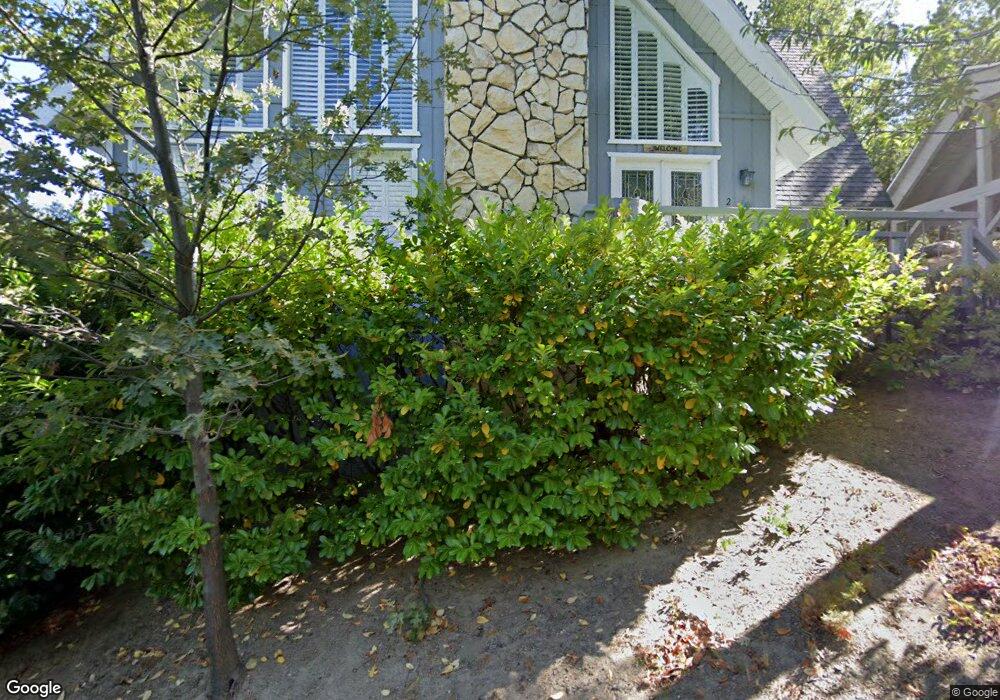
28315 N Bay Rd Unit 2 Lake Arrowhead, CA 92352
Estimated Value: $392,000 - $561,000
3
Beds
3
Baths
1,624
Sq Ft
$307/Sq Ft
Est. Value
About This Home
This home is located at 28315 N Bay Rd Unit 2, Lake Arrowhead, CA 92352 and is currently estimated at $499,204, approximately $307 per square foot. 28315 N Bay Rd Unit 2 is a home located in San Bernardino County with nearby schools including Lake Arrowhead Elementary School, Mary P. Henck Intermediate School, and Rim Of The World Senior High School.
Ownership History
Date
Name
Owned For
Owner Type
Purchase Details
Closed on
Oct 23, 2018
Sold by
Blasingame Terry L
Bought by
Blasingame Terry L
Current Estimated Value
Purchase Details
Closed on
Jul 14, 2003
Sold by
Spencer Nancy L
Bought by
Blasingame Terry L
Home Financials for this Owner
Home Financials are based on the most recent Mortgage that was taken out on this home.
Original Mortgage
$90,000
Interest Rate
5.87%
Mortgage Type
Seller Take Back
Purchase Details
Closed on
Aug 15, 2001
Sold by
Spencer Nancy L
Bought by
Spencer Nancy L
Purchase Details
Closed on
Jul 21, 2000
Sold by
Saperstein Stanley
Bought by
Spencer Nancy L
Home Financials for this Owner
Home Financials are based on the most recent Mortgage that was taken out on this home.
Original Mortgage
$75,000
Interest Rate
8.16%
Mortgage Type
Purchase Money Mortgage
Create a Home Valuation Report for This Property
The Home Valuation Report is an in-depth analysis detailing your home's value as well as a comparison with similar homes in the area
Home Values in the Area
Average Home Value in this Area
Purchase History
| Date | Buyer | Sale Price | Title Company |
|---|---|---|---|
| Blasingame Terry L | -- | None Available | |
| Blasingame Terry L | $224,000 | Commonwealth Title | |
| Spencer Nancy L | -- | -- | |
| Spencer Nancy L | -- | Fidelity National Title | |
| Spencer Nancy L | $158,000 | Fidelity National Title Ins |
Source: Public Records
Mortgage History
| Date | Status | Borrower | Loan Amount |
|---|---|---|---|
| Previous Owner | Blasingame Terry L | $90,000 | |
| Previous Owner | Spencer Nancy L | $75,000 |
Source: Public Records
Tax History Compared to Growth
Tax History
| Year | Tax Paid | Tax Assessment Tax Assessment Total Assessment is a certain percentage of the fair market value that is determined by local assessors to be the total taxable value of land and additions on the property. | Land | Improvement |
|---|---|---|---|---|
| 2025 | $3,565 | $318,482 | $42,654 | $275,828 |
| 2024 | $3,565 | $312,238 | $41,818 | $270,420 |
| 2023 | $3,529 | $306,116 | $40,998 | $265,118 |
| 2022 | $3,456 | $300,114 | $40,194 | $259,920 |
| 2021 | $3,417 | $294,230 | $39,406 | $254,824 |
| 2020 | $3,416 | $291,213 | $39,002 | $252,211 |
| 2019 | $3,329 | $285,503 | $38,237 | $247,266 |
| 2018 | $3,332 | $279,905 | $37,487 | $242,418 |
| 2017 | $3,274 | $274,417 | $36,752 | $237,665 |
| 2016 | $3,213 | $269,036 | $36,031 | $233,005 |
| 2015 | $3,616 | $264,995 | $35,490 | $229,505 |
| 2014 | $3,126 | $259,804 | $34,795 | $225,009 |
Source: Public Records
Map
Nearby Homes
- 0 32 California 173
- 00000 California 173
- 00 California 173
- 356 California 173
- 0 California 173
- 0 Lucerne Ln Unit RW24255511
- 981 Lucerne Ln Unit 3
- 1254 Portillo Ln
- 28245 Arbon Ln
- 966 Willow Creek Rd Unit 25
- 966 Willow Creek Rd Unit 36
- 966 Willow Creek Rd Unit 9
- 28220 Bern Ln
- 1310 Montreal Dr
- 1305 Montreal Dr
- 28103 Arbon Ln
- 1370 Calgary Dr
- 695 Buckingham
- 193 Heliotrope
- 26867 Inyo Ct
- 28315 N Bay Rd
- 28315 N Bay Rd Unit 3
- 28315 N Bay Rd Unit 1
- 28316 N Bay Rd
- 28328 N Bay Rd
- 28340 N Bay Rd
- 1054 State Highway 173
- 1042 State Highway 173
- 1030 Lucerne Ln
- 1212 Portillo
- 28280 N Bay Rd
- 1214 Portillo Ln
- 0 0 California 173
- 000 California 173
- 1211 Portillo Ln
- 107 California 173
- 1042 California 173
- 199 California 173
- 1 California 173
- 1138 California 173