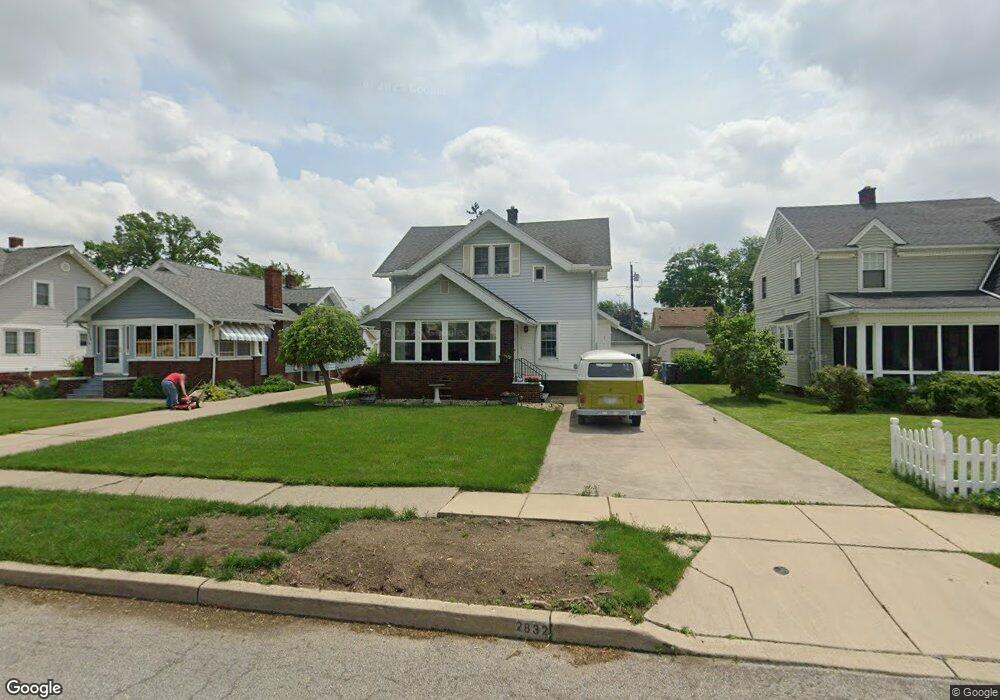
2832 116th St Toledo, OH 43611
Point Place NeighborhoodEstimated Value: $147,000 - $178,000
3
Beds
2
Baths
1,474
Sq Ft
$112/Sq Ft
Est. Value
About This Home
This home is located at 2832 116th St, Toledo, OH 43611 and is currently estimated at $165,470, approximately $112 per square foot. 2832 116th St is a home located in Lucas County with nearby schools including Ottawa River Elementary School, Woodward High School, and Imagine Environmental Science Academy.
Ownership History
Date
Name
Owned For
Owner Type
Purchase Details
Closed on
Dec 26, 2023
Sold by
Brothers Kevin A
Bought by
Ruffier Gary R
Current Estimated Value
Purchase Details
Closed on
Sep 24, 2003
Sold by
Pfaffenberger Thomas Dean and Pfaffenberger Irene
Bought by
Brothers Kevin A
Home Financials for this Owner
Home Financials are based on the most recent Mortgage that was taken out on this home.
Original Mortgage
$75,600
Interest Rate
6.33%
Mortgage Type
Purchase Money Mortgage
Create a Home Valuation Report for This Property
The Home Valuation Report is an in-depth analysis detailing your home's value as well as a comparison with similar homes in the area
Home Values in the Area
Average Home Value in this Area
Purchase History
| Date | Buyer | Sale Price | Title Company |
|---|---|---|---|
| Ruffier Gary R | $125,000 | None Listed On Document | |
| Brothers Kevin A | $94,500 | Northwest Title Agency Of Oh |
Source: Public Records
Mortgage History
| Date | Status | Borrower | Loan Amount |
|---|---|---|---|
| Previous Owner | Brothers Kevin A | $75,600 |
Source: Public Records
Tax History
| Year | Tax Paid | Tax Assessment Tax Assessment Total Assessment is a certain percentage of the fair market value that is determined by local assessors to be the total taxable value of land and additions on the property. | Land | Improvement |
|---|---|---|---|---|
| 2025 | -- | $43,400 | $6,440 | $36,960 |
| 2024 | $1,341 | $43,400 | $6,440 | $36,960 |
| 2023 | $2,287 | $35,140 | $8,925 | $26,215 |
| 2022 | $2,239 | $35,140 | $8,925 | $26,215 |
| 2021 | $2,293 | $35,140 | $8,925 | $26,215 |
| 2020 | $2,157 | $29,085 | $7,385 | $21,700 |
| 2019 | $2,098 | $29,085 | $7,385 | $21,700 |
| 2018 | $1,991 | $29,085 | $7,385 | $21,700 |
| 2017 | $1,893 | $24,640 | $6,265 | $18,375 |
| 2016 | $1,891 | $70,400 | $17,900 | $52,500 |
| 2015 | $1,875 | $70,400 | $17,900 | $52,500 |
| 2014 | $1,550 | $24,650 | $6,270 | $18,380 |
| 2013 | $1,550 | $24,650 | $6,270 | $18,380 |
Source: Public Records
Map
Nearby Homes
- 2750 119th St
- 2749 119th St
- 2968 113th St
- 2835 121st St
- 2934 S 109th St
- 5338 305th St
- 5414 303rd St
- 4532 290th St
- 3045 129th St
- 4539 290th St
- 2352 108th St
- 5531 Ottawa River Rd
- 5331 Whitehouse Dr
- 4418 288th St
- 4565 282nd St
- 5329 Belpre Dr
- 5408 Riviera Dr
- 5433 Brophy Dr
- 4745 Ottawa Trail Rd
- 5516 Fortune Dr