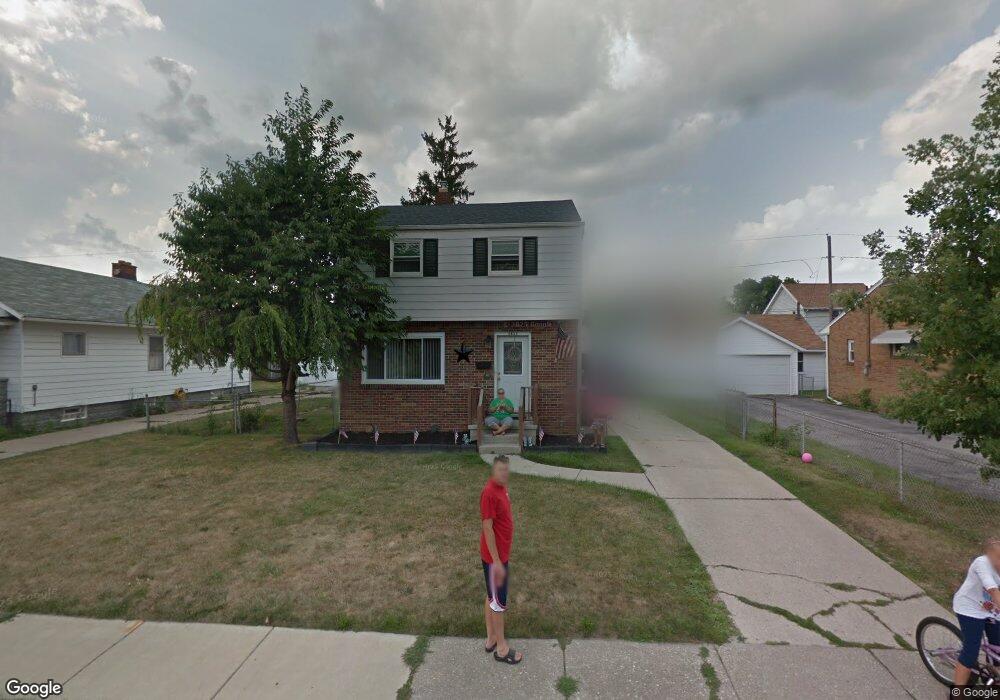
2835 115th St Toledo, OH 43611
Point Place NeighborhoodEstimated Value: $129,912 - $149,000
3
Beds
1
Bath
1,078
Sq Ft
$127/Sq Ft
Est. Value
About This Home
This home is located at 2835 115th St, Toledo, OH 43611 and is currently estimated at $136,978, approximately $127 per square foot. 2835 115th St is a home located in Lucas County with nearby schools including Ottawa River Elementary School, Woodward High School, and Imagine Environmental Science Academy.
Ownership History
Date
Name
Owned For
Owner Type
Purchase Details
Closed on
Nov 4, 2011
Sold by
Fannie Mae
Bought by
Fuhr Ray and Fuhr Kathleen
Current Estimated Value
Purchase Details
Closed on
Jun 21, 2011
Sold by
Patton Dennis M
Bought by
Fannie Mae
Purchase Details
Closed on
Mar 7, 2001
Sold by
Grabner Valentine J and Hartough Joanne
Bought by
Patton Dennis M and Patton Drucilla D
Home Financials for this Owner
Home Financials are based on the most recent Mortgage that was taken out on this home.
Original Mortgage
$69,350
Interest Rate
12.67%
Mortgage Type
Stand Alone First
Create a Home Valuation Report for This Property
The Home Valuation Report is an in-depth analysis detailing your home's value as well as a comparison with similar homes in the area
Home Values in the Area
Average Home Value in this Area
Purchase History
| Date | Buyer | Sale Price | Title Company |
|---|---|---|---|
| Fuhr Ray | $21,500 | Nova Title Agency Inc | |
| Fannie Mae | $46,000 | None Available | |
| Patton Dennis M | $73,000 | Northwest Title Agency Of Oh |
Source: Public Records
Mortgage History
| Date | Status | Borrower | Loan Amount |
|---|---|---|---|
| Previous Owner | Patton Dennis M | $69,350 |
Source: Public Records
Tax History
| Year | Tax Paid | Tax Assessment Tax Assessment Total Assessment is a certain percentage of the fair market value that is determined by local assessors to be the total taxable value of land and additions on the property. | Land | Improvement |
|---|---|---|---|---|
| 2025 | -- | $29,085 | $5,320 | $23,765 |
| 2024 | $924 | $29,085 | $5,320 | $23,765 |
| 2023 | $1,485 | $21,980 | $7,000 | $14,980 |
| 2022 | $1,486 | $21,980 | $7,000 | $14,980 |
| 2021 | $1,517 | $21,980 | $7,000 | $14,980 |
| 2020 | $1,439 | $18,165 | $5,740 | $12,425 |
| 2019 | $1,396 | $18,165 | $5,740 | $12,425 |
| 2018 | $1,333 | $18,165 | $5,740 | $12,425 |
| 2017 | $1,262 | $15,365 | $4,830 | $10,535 |
| 2016 | $1,270 | $43,900 | $13,800 | $30,100 |
| 2015 | $1,261 | $43,900 | $13,800 | $30,100 |
| 2014 | $993 | $15,370 | $4,830 | $10,540 |
| 2013 | $993 | $15,370 | $4,830 | $10,540 |
Source: Public Records
Map
Nearby Homes
- 2857 113th St
- 2968 113th St
- 2750 119th St
- 2749 119th St
- 2934 S 109th St
- 2835 121st St
- 3056 121st St
- 5338 305th St
- 5414 303rd St
- 4532 290th St
- 2426 106th St
- 3045 129th St
- 4539 290th St
- 2352 108th St
- 5531 Ottawa River Rd
- 5329 Belpre Dr
- 5408 Riviera Dr
- 5433 Brophy Dr
- 4745 Ottawa Trail Rd
- 5526 Brophy Dr
Your Personal Tour Guide
Ask me questions while you tour the home.