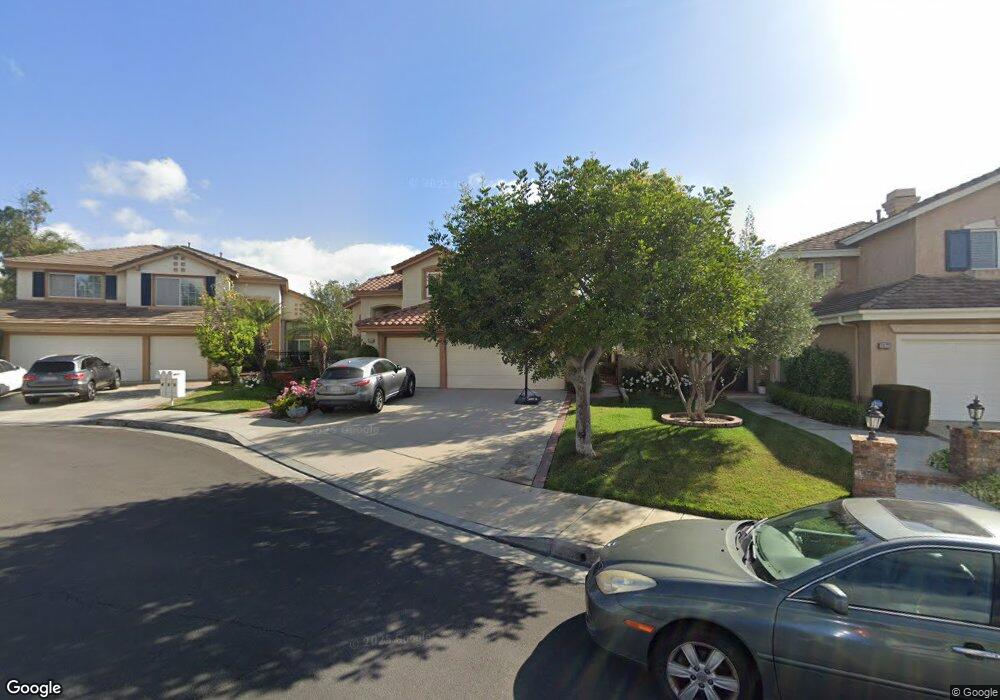
2835 N Preston St Orange, CA 92867
Estimated Value: $1,297,081 - $1,518,000
4
Beds
3
Baths
2,243
Sq Ft
$624/Sq Ft
Est. Value
About This Home
This home is located at 2835 N Preston St, Orange, CA 92867 and is currently estimated at $1,400,520, approximately $624 per square foot. 2835 N Preston St is a home located in Orange County with nearby schools including Nohl Canyon Elementary School, Cerro Villa Middle School, and Villa Park High School.
Ownership History
Date
Name
Owned For
Owner Type
Purchase Details
Closed on
Mar 9, 2012
Sold by
Mcguire Scott W and Mcguire Kathy J
Bought by
Mcguire Scott W and Mcguire Kathy J
Current Estimated Value
Home Financials for this Owner
Home Financials are based on the most recent Mortgage that was taken out on this home.
Original Mortgage
$241,300
Outstanding Balance
$30,835
Interest Rate
3.84%
Mortgage Type
New Conventional
Estimated Equity
$1,369,685
Purchase Details
Closed on
Apr 7, 2003
Sold by
Mcguire Scott W and Mcguire Kathy J
Bought by
Mcguire Scott W and Mcguire Kathy J
Purchase Details
Closed on
May 23, 1994
Sold by
Pacific Ridge Partners
Bought by
Mcguire Scott W and Mcguire Kathy J
Home Financials for this Owner
Home Financials are based on the most recent Mortgage that was taken out on this home.
Original Mortgage
$257,200
Interest Rate
5.12%
Create a Home Valuation Report for This Property
The Home Valuation Report is an in-depth analysis detailing your home's value as well as a comparison with similar homes in the area
Home Values in the Area
Average Home Value in this Area
Purchase History
We collect this data history from publicly available records. To have your information removed, we recommend requesting removal directly through your county’s website.
| Date | Buyer | Sale Price | Title Company |
|---|---|---|---|
| Mcguire Scott W | -- | Accommodation | |
| Mcguire Scott W | -- | Fidelity National Title Co | |
| Mcguire Scott W | -- | New Century Title Company | |
| Mcguire Scott W | $286,000 | First American Title Ins Co |
Source: Public Records
Mortgage History
We collect this data history from publicly available records. To have your information removed, we recommend requesting removal directly through your county’s website.
| Date | Status | Borrower | Loan Amount |
|---|---|---|---|
| Open | Mcguire Scott W | $241,300 | |
| Closed | Mcguire Scott W | $257,200 |
Source: Public Records
Tax History
| Year | Tax Paid | Tax Assessment Tax Assessment Total Assessment is a certain percentage of the fair market value that is determined by local assessors to be the total taxable value of land and additions on the property. | Land | Improvement |
|---|---|---|---|---|
| 2025 | $5,353 | $485,732 | $155,496 | $330,236 |
| 2024 | $5,353 | $476,208 | $152,447 | $323,761 |
| 2023 | $5,232 | $466,871 | $149,458 | $317,413 |
| 2022 | $5,129 | $457,717 | $146,527 | $311,190 |
| 2021 | $4,986 | $448,743 | $143,654 | $305,089 |
| 2020 | $4,939 | $444,142 | $142,181 | $301,961 |
| 2019 | $4,877 | $435,434 | $139,393 | $296,041 |
| 2018 | $4,802 | $426,897 | $136,660 | $290,237 |
| 2017 | $4,603 | $418,527 | $133,980 | $284,547 |
| 2016 | $4,514 | $410,321 | $131,353 | $278,968 |
| 2015 | $4,447 | $404,158 | $129,380 | $274,778 |
| 2014 | $4,351 | $396,242 | $126,846 | $269,396 |
Source: Public Records
Map
Nearby Homes
- 656 S Andover Dr
- 2568 N San Miguel Dr
- 5322 E Gabrielle Ln
- 18782 Peppertree Dr
- 5461 E Estate Ridge Rd
- 3911 E Rolling Green Ln
- 9275 Hidden Valley Dr
- 595 S Avenida Faro
- 436 S Westridge Cir
- 2759 N Chauncey Ln
- 2282 N Rockridge Place
- 18808 Canyon Crest Dr
- 3226 E Ridgeway Rd
- 18777 Mesa Dr
- 5620 E Calle Canada
- 3438 E Meadowridge Rd
- 9641 Janice Cir
- 18811 Ridgeview Cir
- 0 Cannon St
- 5810 E Mountain Loop Trail Unit 35
- 2821 N Preston St
- 2803 N Preston St
- 2828 N Danbury St
- 2834 N Danbury St
- 2827 N Preston St
- 2822 N Danbury St
- 2840 N Danbury St
- 2802 N Preston St
- 2802 N Preston St
- 2818 N Preston St
- 2794 N Preston St
- 2854 N Danbury St
- 4620 E Somerton Ave
- 2822 N Preston St
- 4614 E Somerton Ave
- 2788 N Preston St
- 4624 E Somerton Ave
- 2841 N Preston St
- 4641 E Somerton Ave
- 4608 E Somerton Ave
Your Personal Tour Guide
Ask me questions while you tour the home.