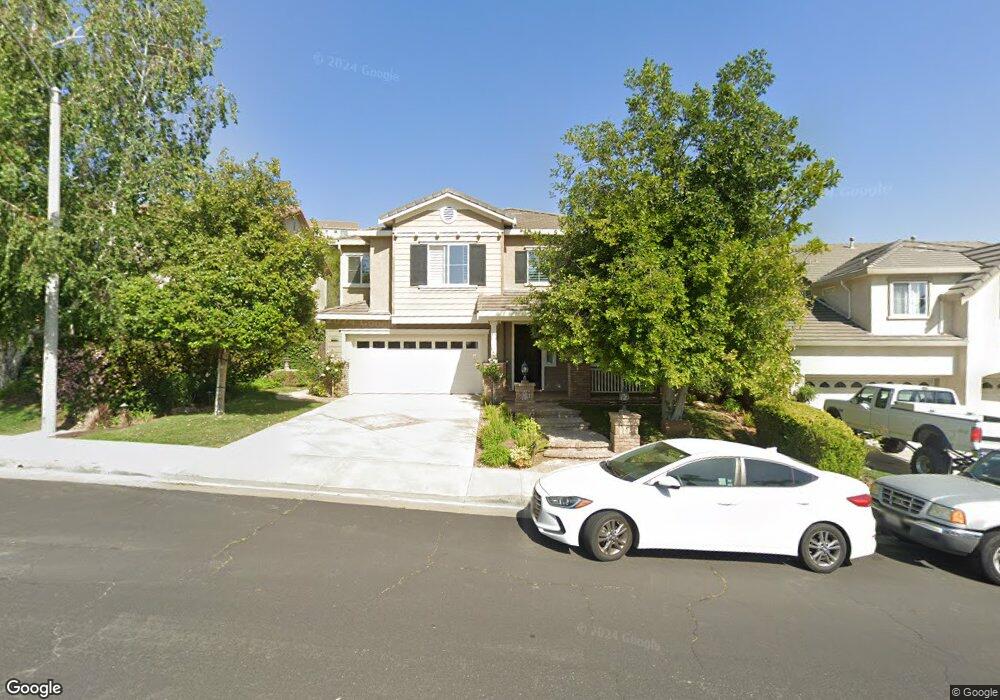
28350 Hidden Hills Dr Santa Clarita, CA 91390
Saugus NeighborhoodEstimated Value: $1,089,000 - $1,264,000
4
Beds
3
Baths
3,313
Sq Ft
$350/Sq Ft
Est. Value
About This Home
This home is located at 28350 Hidden Hills Dr, Santa Clarita, CA 91390 and is currently estimated at $1,158,158, approximately $349 per square foot. 28350 Hidden Hills Dr is a home located in Los Angeles County with nearby schools including James Foster Elementary School, Arroyo Seco Junior High School, and Saugus High School.
Ownership History
Date
Name
Owned For
Owner Type
Purchase Details
Closed on
Nov 6, 2014
Sold by
Maloney Thomas A and Maloney Lisa Anne
Bought by
Maloney Family Trust
Current Estimated Value
Home Financials for this Owner
Home Financials are based on the most recent Mortgage that was taken out on this home.
Original Mortgage
$557,600
Outstanding Balance
$429,648
Interest Rate
4.16%
Mortgage Type
New Conventional
Estimated Equity
$728,510
Purchase Details
Closed on
Jul 12, 2007
Sold by
Maloney Thomas A and Maloney Lisa A
Bought by
Maloney Thomas A and Maloney Lisa A
Purchase Details
Closed on
Mar 6, 2002
Sold by
Davidon Homes
Bought by
Maloney Thomas Alec and Maloney Lisa A
Home Financials for this Owner
Home Financials are based on the most recent Mortgage that was taken out on this home.
Original Mortgage
$367,900
Interest Rate
6.16%
Create a Home Valuation Report for This Property
The Home Valuation Report is an in-depth analysis detailing your home's value as well as a comparison with similar homes in the area
Home Values in the Area
Average Home Value in this Area
Purchase History
| Date | Buyer | Sale Price | Title Company |
|---|---|---|---|
| Maloney Family Trust | -- | Provident Title Company | |
| Maloney Thomas A | -- | Provident Title Company | |
| Maloney Thomas A | -- | None Available | |
| Maloney Thomas Alec | $460,000 | First American Title Co |
Source: Public Records
Mortgage History
| Date | Status | Borrower | Loan Amount |
|---|---|---|---|
| Open | Maloney Thomas A | $557,600 | |
| Previous Owner | Maloney Thomas Alec | $367,900 |
Source: Public Records
Tax History Compared to Growth
Tax History
| Year | Tax Paid | Tax Assessment Tax Assessment Total Assessment is a certain percentage of the fair market value that is determined by local assessors to be the total taxable value of land and additions on the property. | Land | Improvement |
|---|---|---|---|---|
| 2025 | $10,491 | $741,607 | $266,353 | $475,254 |
| 2024 | $10,491 | $727,067 | $261,131 | $465,936 |
| 2023 | $10,254 | $712,811 | $256,011 | $456,800 |
| 2022 | $10,301 | $698,836 | $250,992 | $447,844 |
| 2021 | $10,131 | $685,134 | $246,071 | $439,063 |
| 2019 | $9,800 | $664,814 | $238,773 | $426,041 |
| 2018 | $9,490 | $651,780 | $234,092 | $417,688 |
| 2016 | $8,839 | $626,472 | $225,002 | $401,470 |
| 2015 | $8,579 | $617,063 | $221,623 | $395,440 |
| 2014 | $8,459 | $604,976 | $217,282 | $387,694 |
Source: Public Records
Map
Nearby Homes
- 22045 Milestone St
- 28419 Hidden Hills Dr
- 22025 Lytle Ct
- 22035 Conway Place
- 28410 Agajanian Dr
- 21965 Jeffers Ln
- 22440 Skylake Place
- 28626 Natalie Ln
- 27929 Dexter Dr
- 28412 Rock Canyon Dr
- 28241 Tamarack Ln
- 22617 Copper Hill Dr Unit 121
- 21756 Redwood Canyon Place
- 27829 Carnegie Ave
- 28321 Evergreen Ln
- 22713 Copper Hill Dr Unit 42
- 28114 Seco Canyon Rd Unit 156
- 28314 Easton Ln
- 21741 Jeffers Ln
- 28345 Seco Canyon Rd Unit 97
- 28358 Hidden Hills Dr
- 28344 Hidden Hills Dr
- 28362 Hidden Hills Dr
- 28338 Hidden Hills Dr
- 22069 Milestone St
- 28368 Hidden Hills Dr
- 22063 Milestone St
- 28349 Hidden Hills Dr
- 28355 Hidden Hills Dr
- 28341 Hidden Hills Dr
- 28367 Hidden Hills Dr
- 28374 Hidden Hills Dr
- 28361 Hidden Hills Dr
- 28335 Hidden Hills Dr
- 22055 Milestone St
- 28331 Incline Ln
- 28322 Hidden Hills Dr
- 28339 Incline Ln
- 28375 Hidden Hills Dr
- 28380 Hidden Hills Dr