Estimated Value: $429,000 - $489,000
3
Beds
2
Baths
1,452
Sq Ft
$315/Sq Ft
Est. Value
About This Home
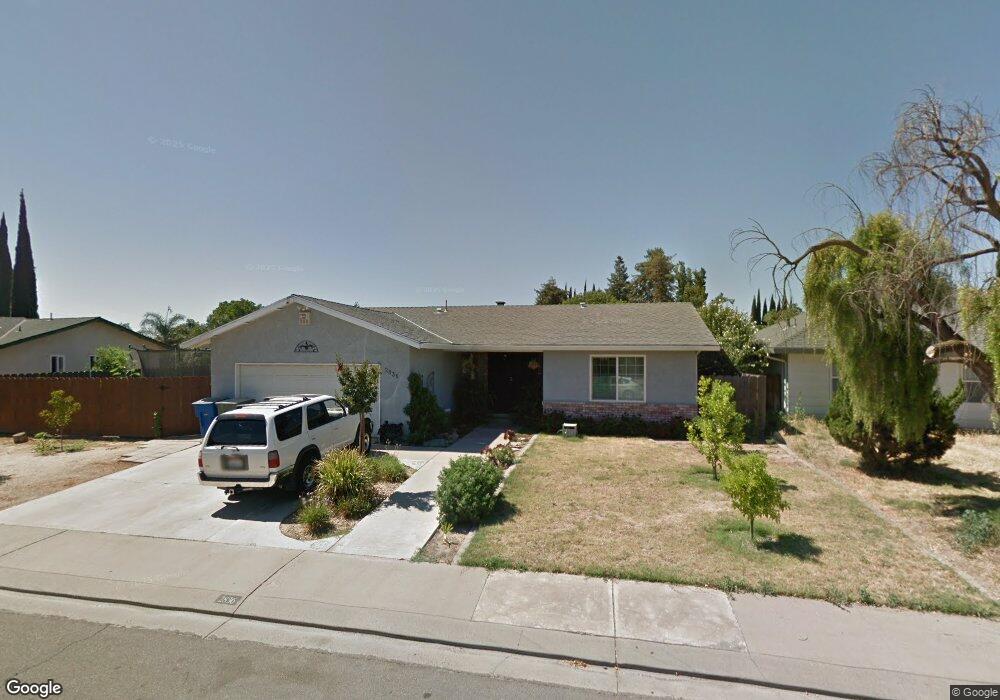
This home is located at 2836 Roswell Way, Ceres, CA 95307 and is currently estimated at $457,633, approximately $315 per square foot. 2836 Roswell Way is a home located in Stanislaus County with nearby schools including Cesar Chavez Junior High School, Central Valley High School, and Whitmore Charter High School.
Ownership History
Date
Name
Owned For
Owner Type
Purchase Details
Closed on
Mar 16, 2011
Sold by
Zarate Jose A
Bought by
Arellano Miguel and Zarate Alexandrea
Current Estimated Value
Purchase Details
Closed on
Oct 12, 2010
Sold by
California Pacific Investments Llc
Bought by
Zarate Jose A
Purchase Details
Closed on
Jul 9, 2010
Sold by
Ramirez Scott D
Bought by
California Pacific Investments Llc
Purchase Details
Closed on
Mar 13, 1998
Sold by
Sheffield Jerry M and Sheffield Anita L
Bought by
Ramirez Scott D
Home Financials for this Owner
Home Financials are based on the most recent Mortgage that was taken out on this home.
Original Mortgage
$112,219
Interest Rate
7.06%
Mortgage Type
FHA
Create a Home Valuation Report for This Property
The Home Valuation Report is an in-depth analysis detailing your home's value as well as a comparison with similar homes in the area
Purchase History
| Date | Buyer | Sale Price | Title Company |
|---|---|---|---|
| Arellano Miguel | -- | None Listed On Document | |
| Zarate Jose A | $142,500 | Chicago Title Company | |
| California Pacific Investments Llc | $97,739 | None Available | |
| Ramirez Scott D | $113,000 | North American Title Co |
Source: Public Records
Mortgage History
| Date | Status | Borrower | Loan Amount |
|---|---|---|---|
| Previous Owner | Ramirez Scott D | $112,219 |
Source: Public Records
Tax History
| Year | Tax Paid | Tax Assessment Tax Assessment Total Assessment is a certain percentage of the fair market value that is determined by local assessors to be the total taxable value of land and additions on the property. | Land | Improvement |
|---|---|---|---|---|
| 2025 | $5,391 | $467,670 | $204,000 | $263,670 |
| 2024 | $1,927 | $178,973 | $43,954 | $135,019 |
| 2023 | $1,874 | $175,465 | $43,093 | $132,372 |
| 2022 | $1,857 | $172,026 | $42,249 | $129,777 |
| 2021 | $1,838 | $168,654 | $41,421 | $127,233 |
| 2020 | $1,780 | $166,926 | $40,997 | $125,929 |
| 2019 | $1,768 | $163,654 | $40,194 | $123,460 |
| 2018 | $1,730 | $160,446 | $39,406 | $121,040 |
| 2017 | $1,715 | $157,301 | $38,634 | $118,667 |
| 2016 | $1,679 | $154,218 | $37,877 | $116,341 |
| 2015 | $1,655 | $151,903 | $37,309 | $114,594 |
| 2014 | $1,620 | $148,929 | $36,579 | $112,350 |
Source: Public Records
Map
Nearby Homes
- 2812 Roswell Way
- 2708 Oasis Ave
- 3010 Roeding Rd
- 3550 Mitchell Rd Unit 59
- 3012 Donner Dr Unit 32
- 3524 Homestead Way Unit 57
- 3632 9th St
- 2921 5th St
- 3408 Puma Way
- 3432 Vera Way
- 3009 Glen Grove Ct
- 1954 Robin Dr
- 3613 Southern Oak Dr
- 2841 Fowler Rd Unit 33
- 3939 Central Ave Unit 157
- 3939 Central Ave Unit 126
- 3939 Central Ave Unit 35
- 3939 Central Ave Unit 178
- 1813 Lupin Ln
- 3221 E Redwood Rd
- 2832 Roswell Way
- 2840 Roswell Way
- 2835 Robmar Ct
- 2839 Robmar Ct
- 2828 Roswell Way
- 3212 Barry Ct
- 2835 Roswell Way
- 2839 Roswell Way
- 2833 Roswell Way
- 3213 Barry Ct
- 2824 Roswell Way
- 2829 Roswell Way
- 3121 Vernal Dr
- 3200 Vernal Dr
- 3204 Vernal Dr
- 2825 Roswell Way
- 2836 Robmar Ct
- 2820 Roswell Way
- 3124 Vernal Dr
- 3208 Vernal Dr
Your Personal Tour Guide
Ask me questions while you tour the home.