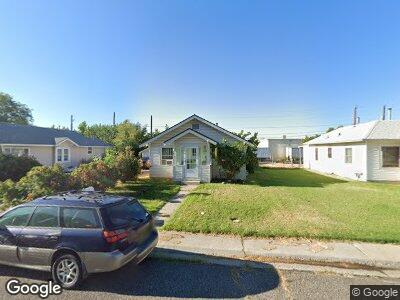
2837 Kennedy Ave Grand Junction, CO 81501
Downtown Grand Junction NeighborhoodEstimated Value: $228,156 - $261,000
1
Bed
1
Bath
720
Sq Ft
$340/Sq Ft
Est. Value
About This Home
This home is located at 2837 Kennedy Ave, Grand Junction, CO 81501 and is currently estimated at $244,789, approximately $339 per square foot. 2837 Kennedy Ave is a home located in Mesa County with nearby schools including Nisley Elementary School, Bookcliff Middle School, and Central High School.
Ownership History
Date
Name
Owned For
Owner Type
Purchase Details
Closed on
Apr 2, 2018
Sold by
Cook Darren Arthur and Lovelace Robert D
Bought by
Stanfield Brandon
Current Estimated Value
Home Financials for this Owner
Home Financials are based on the most recent Mortgage that was taken out on this home.
Original Mortgage
$117,800
Interest Rate
4.38%
Mortgage Type
New Conventional
Purchase Details
Closed on
Sep 9, 2011
Sold by
The Secretary Of Veterans Affairs
Bought by
Cook Darren A
Purchase Details
Closed on
Jul 13, 2011
Sold by
Wells Fargo Bank Na
Bought by
The Secretary Of Veterans Affairs
Purchase Details
Closed on
Mar 31, 2006
Sold by
Hetherington Mary Ellen and Walton Mary Joan
Bought by
Hepburn Vancil R
Home Financials for this Owner
Home Financials are based on the most recent Mortgage that was taken out on this home.
Original Mortgage
$121,377
Interest Rate
6.21%
Mortgage Type
VA
Create a Home Valuation Report for This Property
The Home Valuation Report is an in-depth analysis detailing your home's value as well as a comparison with similar homes in the area
Home Values in the Area
Average Home Value in this Area
Purchase History
| Date | Buyer | Sale Price | Title Company |
|---|---|---|---|
| Stanfield Brandon | $124,000 | Fidelity National Title | |
| Cook Darren A | -- | Heritage Title | |
| The Secretary Of Veterans Affairs | -- | None Available | |
| Hepburn Vancil R | $117,500 | Fahtco |
Source: Public Records
Mortgage History
| Date | Status | Borrower | Loan Amount |
|---|---|---|---|
| Open | Stanfield Brandn | $117,000 | |
| Closed | Stanfield Brandon | $117,800 | |
| Previous Owner | Hepburn Vancil R | $121,377 |
Source: Public Records
Tax History Compared to Growth
Tax History
| Year | Tax Paid | Tax Assessment Tax Assessment Total Assessment is a certain percentage of the fair market value that is determined by local assessors to be the total taxable value of land and additions on the property. | Land | Improvement |
|---|---|---|---|---|
| 2024 | $744 | $10,520 | $3,720 | $6,800 |
| 2023 | $744 | $10,520 | $3,720 | $6,800 |
| 2022 | $753 | $10,440 | $3,480 | $6,960 |
| 2021 | $756 | $10,750 | $3,580 | $7,170 |
| 2020 | $603 | $8,780 | $3,220 | $5,560 |
| 2019 | $570 | $8,780 | $3,220 | $5,560 |
| 2018 | $443 | $6,220 | $3,240 | $2,980 |
| 2017 | $412 | $6,220 | $3,240 | $2,980 |
| 2016 | $412 | $6,520 | $3,380 | $3,140 |
| 2015 | $418 | $6,520 | $3,380 | $3,140 |
| 2014 | $381 | $5,990 | $2,790 | $3,200 |
Source: Public Records
Map
Nearby Homes
- 2846 Kennedy Ave Unit A
- 518 Compton St
- 2845 North Ave Unit 12
- 2845 North Ave Unit 5
- 2845 North Ave Unit 7
- 2863 Elm Ave
- 510 Court Rd
- 2856 1/2 Texas Ave
- 544 28 1 2 Rd
- 543 1/2 Wasatch St
- 2814 Texas Ave
- 536 1/2 Normandy Way
- 2844 1/2 Hall Ave
- 2810 Bunting Ave
- 575 28 1 4 Rd Unit 2
- TBD 28 1 4 Rd
- 548 1/2 Normandy Way
- 2814 S Niagara Cir
- 2803 Mesa Ave
- 575 28 1 2 Rd Unit 66
- 2837 Kennedy Ave
- 2835 Kennedy Ave
- 516 Compton St
- 2841 Kennedy Ave Unit A
- 0 Kennedy Ave Unit 753027
- 0 Kennedy Ave Unit A 605066
- 0 Kennedy Ave Unit 605868
- 0 Kennedy Ave Unit 619038
- 0 Kennedy Ave Unit B 619993
- 0 Kennedy Ave Unit 629169
- 0 Kennedy Ave Unit 631412
- 0 Kennedy Ave Unit 633848
- 0 Kennedy Ave Unit 634991
- 0 Kennedy Ave Unit 636670
- 0 Kennedy Ave Unit 639378
- 0 Kennedy Ave Unit 640120
- 0 Kennedy Ave Unit 642005
- 0 Kennedy Ave Unit 644941
- 0 Kennedy Ave Unit 648713
- 0 Kennedy Ave Unit 610836