2838 Casona Way Raleigh, NC 27616
Forestville NeighborhoodEstimated Value: $254,000 - $283,000
2
Beds
3
Baths
1,279
Sq Ft
$207/Sq Ft
Est. Value
About This Home
This home is located at 2838 Casona Way, Raleigh, NC 27616 and is currently estimated at $265,265, approximately $207 per square foot. 2838 Casona Way is a home located in Wake County with nearby schools including Harris Creek Elementary School, Rolesville Middle School, and Rolesville High School.
Ownership History
Date
Name
Owned For
Owner Type
Purchase Details
Closed on
Mar 30, 2017
Sold by
Hassell Gary and Hassell Susan
Bought by
Watts Natasha M
Current Estimated Value
Home Financials for this Owner
Home Financials are based on the most recent Mortgage that was taken out on this home.
Original Mortgage
$144,530
Outstanding Balance
$120,073
Interest Rate
4.15%
Mortgage Type
New Conventional
Estimated Equity
$145,192
Purchase Details
Closed on
Jun 17, 2013
Sold by
Montanez Pagan Lucas J and Abreu Garcia Carla N
Bought by
Hassell Gary and Hassell Susan
Purchase Details
Closed on
Mar 25, 2010
Sold by
Centex Homes
Bought by
Montanez Pagan Lucas J and Abreu Garcia Carla N
Home Financials for this Owner
Home Financials are based on the most recent Mortgage that was taken out on this home.
Original Mortgage
$134,859
Interest Rate
4.93%
Mortgage Type
New Conventional
Create a Home Valuation Report for This Property
The Home Valuation Report is an in-depth analysis detailing your home's value as well as a comparison with similar homes in the area
Home Values in the Area
Average Home Value in this Area
Purchase History
| Date | Buyer | Sale Price | Title Company |
|---|---|---|---|
| Watts Natasha M | $149,000 | None Available | |
| Hassell Gary | $116,500 | None Available | |
| Montanez Pagan Lucas J | $139,500 | None Available |
Source: Public Records
Mortgage History
| Date | Status | Borrower | Loan Amount |
|---|---|---|---|
| Open | Watts Natasha M | $144,530 | |
| Previous Owner | Montanez Pagan Lucas J | $134,859 |
Source: Public Records
Tax History Compared to Growth
Tax History
| Year | Tax Paid | Tax Assessment Tax Assessment Total Assessment is a certain percentage of the fair market value that is determined by local assessors to be the total taxable value of land and additions on the property. | Land | Improvement |
|---|---|---|---|---|
| 2025 | $2,241 | $254,629 | $80,000 | $174,629 |
| 2024 | $2,231 | $254,629 | $80,000 | $174,629 |
| 2023 | $1,872 | $169,936 | $35,000 | $134,936 |
| 2022 | $1,741 | $169,936 | $35,000 | $134,936 |
| 2021 | $1,673 | $169,936 | $35,000 | $134,936 |
| 2020 | $1,643 | $169,936 | $35,000 | $134,936 |
| 2019 | $1,580 | $134,636 | $32,000 | $102,636 |
| 2018 | $1,491 | $134,636 | $32,000 | $102,636 |
| 2017 | $1,421 | $134,636 | $32,000 | $102,636 |
| 2016 | $1,392 | $134,636 | $32,000 | $102,636 |
| 2015 | -- | $138,055 | $32,000 | $106,055 |
| 2014 | -- | $138,055 | $32,000 | $106,055 |
Source: Public Records
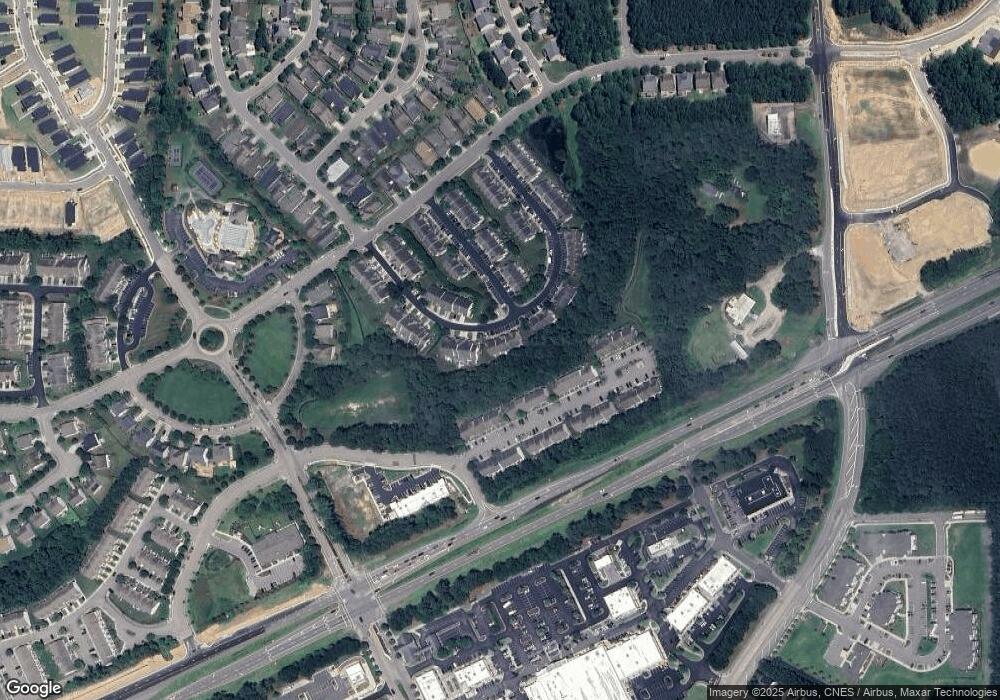
Map
Nearby Homes
- 2821 Casona Way
- 8520 Quarton Dr
- 4007 Newell Ln
- 8602 Holdenby Trail
- 2716 Sammish Way
- 2726 Sammish Way
- 2718 Sammish Way
- 2730 Sammish Way
- 2724 Way
- 2628 Pivot Ridge Dr
- Magnolia Plan at Forestville Station
- Birch Plan at Forestville Station
- Willow Plan at Forestville Station
- Sage Plan at Forestville Station
- 8715 Wardle Ct
- Plan 1501 Modeled at Tucker Place
- Plan 1808 at Tucker Place
- Plan 2764 Modeled at Tucker Place
- Plan 1638 at Tucker Place
- Plan 1342 at Tucker Place
- 2840 Casona Way
- 2836 Casona Way
- 2836 Casona Way Unit 731
- 2842 Casona Way
- 2844 Casona Way
- 2846 Casona Way
- 2832 Casona Way
- 2830 Casona Way
- 2828 Casona Way
- 2827 Casona Way
- 2900 Casona Way
- 2826 Casona Way
- 2902 Casona Way
- 8525 Quarton Dr
- 8527 Quarton Dr
- 8529 Quarton Dr
- 8523 Quarton Dr
- 2825 Casona Way
- 8531 Quarton Dr
- 8521 Quarton Dr