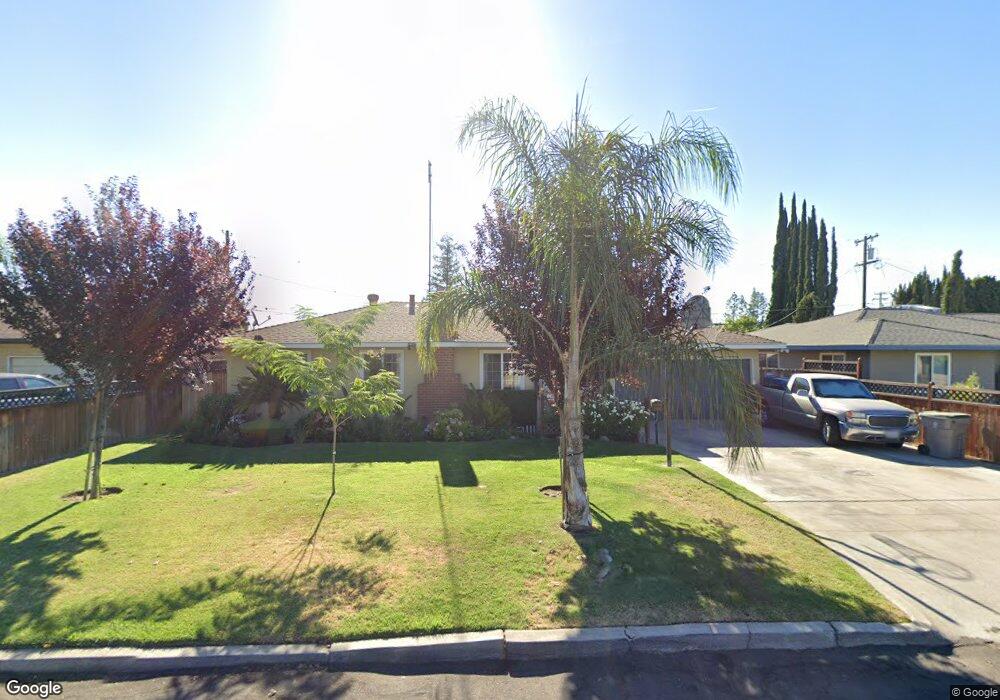
2838 N Chance Ave Fresno, CA 93703
McLane NeighborhoodEstimated Value: $247,000 - $326,000
3
Beds
1
Bath
1,060
Sq Ft
$269/Sq Ft
Est. Value
About This Home
This home is located at 2838 N Chance Ave, Fresno, CA 93703 and is currently estimated at $284,645, approximately $268 per square foot. 2838 N Chance Ave is a home located in Fresno County with nearby schools including Norseman Elementary School, Scandinavian Middle School, and Mclane High School.
Ownership History
Date
Name
Owned For
Owner Type
Purchase Details
Closed on
Mar 15, 2021
Sold by
Torres Raul A and Torres Marissa
Bought by
Torres Raul A and Torres Marissa
Current Estimated Value
Purchase Details
Closed on
Jun 5, 1996
Sold by
Kanzler Kittie Patricia
Bought by
Kanzler Ronald G
Home Financials for this Owner
Home Financials are based on the most recent Mortgage that was taken out on this home.
Original Mortgage
$67,842
Outstanding Balance
$4,346
Interest Rate
8.03%
Mortgage Type
FHA
Estimated Equity
$280,299
Purchase Details
Closed on
Jun 4, 1996
Sold by
Kanzler Ronald G and Strunk Iva Jo
Bought by
Torres Raul A and Torres Maria I
Home Financials for this Owner
Home Financials are based on the most recent Mortgage that was taken out on this home.
Original Mortgage
$67,842
Outstanding Balance
$4,346
Interest Rate
8.03%
Mortgage Type
FHA
Estimated Equity
$280,299
Purchase Details
Closed on
Oct 24, 1994
Sold by
Kanzler Glenn
Bought by
Kanzler Glenn and Strunk Iva Jo
Create a Home Valuation Report for This Property
The Home Valuation Report is an in-depth analysis detailing your home's value as well as a comparison with similar homes in the area
Home Values in the Area
Average Home Value in this Area
Purchase History
| Date | Buyer | Sale Price | Title Company |
|---|---|---|---|
| Torres Raul A | -- | None Available | |
| Kanzler Ronald G | -- | First American Title Ins Co | |
| Strunk Iva Jo | -- | First American Title Ins Co | |
| Torres Raul A | $68,000 | First American Title Ins Co | |
| Kanzler Glenn | -- | -- |
Source: Public Records
Mortgage History
| Date | Status | Borrower | Loan Amount |
|---|---|---|---|
| Open | Torres Raul A | $67,842 | |
| Closed | Torres Raul A | $3,628 |
Source: Public Records
Tax History Compared to Growth
Tax History
| Year | Tax Paid | Tax Assessment Tax Assessment Total Assessment is a certain percentage of the fair market value that is determined by local assessors to be the total taxable value of land and additions on the property. | Land | Improvement |
|---|---|---|---|---|
| 2025 | $1,358 | $110,557 | $34,186 | $76,371 |
| 2023 | $1,333 | $106,265 | $32,859 | $73,406 |
| 2022 | $1,315 | $104,182 | $32,215 | $71,967 |
| 2021 | $1,279 | $102,140 | $31,584 | $70,556 |
| 2020 | $1,274 | $101,094 | $31,261 | $69,833 |
| 2019 | $1,224 | $99,113 | $30,649 | $68,464 |
| 2018 | $1,198 | $97,171 | $30,049 | $67,122 |
| 2017 | $1,178 | $95,266 | $29,460 | $65,806 |
| 2016 | $1,139 | $93,399 | $28,883 | $64,516 |
| 2015 | $1,122 | $91,997 | $28,450 | $63,547 |
| 2014 | $1,101 | $90,196 | $27,893 | $62,303 |
Source: Public Records
Map
Nearby Homes
- 4454 E Simpson Ave
- 4625 E Princeton Ave
- 3926 E Fountain Way
- 4674 E Princeton Ave
- 3445 N 9th St
- 2238 N Maple Ave
- 3803 E Shields Ave
- 4704 E Simpson Ave
- 4597 E Cambridge Ave
- 3803 E Clinton Ave
- 4617 E Garland Ave
- 2243 E Cambridge Ave
- 4002 E Dakota Ave Unit 104
- 4641 E Weldon Ave
- 3645 E Cortland Ave
- 4747 E Clinton Ave
- 3646 E Dayton Ave
- 4787 E Cornell Ave
- 4318 E Fairfax Ave
- 2848 N Chance Ave
- 2828 N Chance Ave
- 2837 N Barton Ave
- 2847 N Barton Ave
- 2827 N Barton Ave
- 2908 N Chance Ave
- 2818 N Chance Ave
- 2907 N Barton Ave
- 2835 N Chance Ave
- 2817 N Barton Ave
- 2825 N Chance Ave
- 2845 N Chance Ave
- 2918 N Chance Ave
- 2808 N Chance Ave
- 2815 N Chance Ave
- 2905 N Chance Ave
- 2917 N Barton Ave
- 2807 N Barton Ave
- 4455 E Princeton Ave
- 2915 N Chance Ave