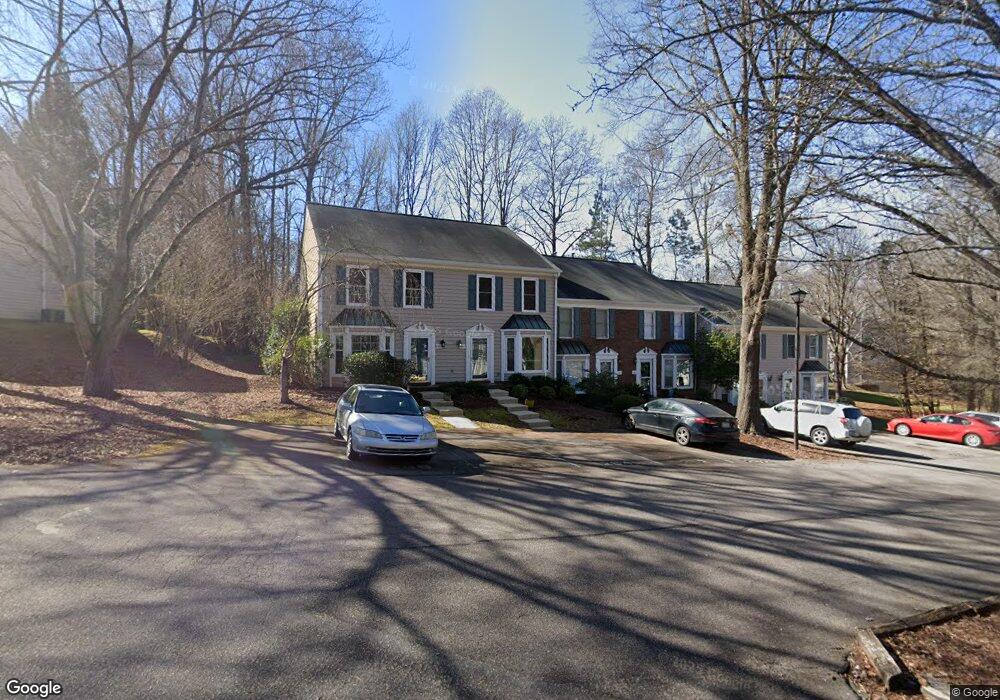
284 Beechtree Dr Cary, NC 27513
Weston NeighborhoodEstimated Value: $264,000 - $311,000
2
Beds
3
Baths
1,352
Sq Ft
$216/Sq Ft
Est. Value
About This Home
This home is located at 284 Beechtree Dr, Cary, NC 27513 and is currently estimated at $292,112, approximately $216 per square foot. 284 Beechtree Dr is a home located in Wake County with nearby schools including Reedy Creek Elementary School, Reedy Creek Magnet Middle School, and Cary High School.
Ownership History
Date
Name
Owned For
Owner Type
Purchase Details
Closed on
Jul 22, 2016
Sold by
Dufour Kevin R
Bought by
Weakland Laura C
Current Estimated Value
Home Financials for this Owner
Home Financials are based on the most recent Mortgage that was taken out on this home.
Original Mortgage
$158,000
Outstanding Balance
$128,784
Interest Rate
4.25%
Mortgage Type
Adjustable Rate Mortgage/ARM
Estimated Equity
$163,328
Purchase Details
Closed on
Oct 31, 2013
Sold by
Perrin Christy
Bought by
Dufour Kevin R
Home Financials for this Owner
Home Financials are based on the most recent Mortgage that was taken out on this home.
Original Mortgage
$123,500
Interest Rate
4.23%
Mortgage Type
New Conventional
Purchase Details
Closed on
May 29, 2001
Sold by
Rearick Jeffrey A
Bought by
Perrin Christy
Home Financials for this Owner
Home Financials are based on the most recent Mortgage that was taken out on this home.
Original Mortgage
$94,000
Interest Rate
5.75%
Create a Home Valuation Report for This Property
The Home Valuation Report is an in-depth analysis detailing your home's value as well as a comparison with similar homes in the area
Home Values in the Area
Average Home Value in this Area
Purchase History
| Date | Buyer | Sale Price | Title Company |
|---|---|---|---|
| Weakland Laura C | $158,000 | None Available | |
| Dufour Kevin R | $130,000 | None Available | |
| Perrin Christy | $111,000 | -- |
Source: Public Records
Mortgage History
| Date | Status | Borrower | Loan Amount |
|---|---|---|---|
| Open | Weakland Laura C | $158,000 | |
| Previous Owner | Dufour Kevin R | $123,500 | |
| Previous Owner | Perrin Christy | $94,000 |
Source: Public Records
Tax History
| Year | Tax Paid | Tax Assessment Tax Assessment Total Assessment is a certain percentage of the fair market value that is determined by local assessors to be the total taxable value of land and additions on the property. | Land | Improvement |
|---|---|---|---|---|
| 2025 | $2,585 | $299,225 | $115,000 | $184,225 |
| 2024 | $2,529 | $299,225 | $115,000 | $184,225 |
Source: Public Records
Map
Nearby Homes
- 319 Silverberry Ct
- 292 Beechtree Dr
- 112 Rock Pointe Ln
- 401 Tynemouth Dr
- 1399 N Harrison Ave
- 102 Bathgate Ln
- 109 Silverrock Ct
- 106 Eagle Swoop Ct
- 508 Nantucket Dr
- 101 Red Stone Ct
- 209 Juliet Cir
- 102 Choptank Ct Unit B2
- 917 Reedy Creek Rd
- 105 Twilight Ct
- 212 Esquire Ln
- 101 Brant Point Place
- 201 Windbyrne Dr
- 220 Windbyrne Dr Unit 38
- 243 Windbyrne Dr
- 316 Matilda Place
- 286 Beechtree Dr
- 282 Beechtree Dr
- 280 Beechtree Dr
- 278 Beechtree Dr
- 276 Beechtree Dr
- 288 Beechtree Dr
- 290 Beechtree Dr
- 334 Silverberry Ct
- 336 Silverberry Ct
- 332 Silverberry Ct Unit 97
- 338 Silverberry Ct
- 294 Beechtree Dr
- 340 Silverberry Ct
- 330 Silverberry Ct
- 342 Silverberry Ct
- 296 Beechtree Dr
- 328 Silverberry Ct
- 274 Beechtree Dr
- 250 Beechtree Dr
Your Personal Tour Guide
Ask me questions while you tour the home.