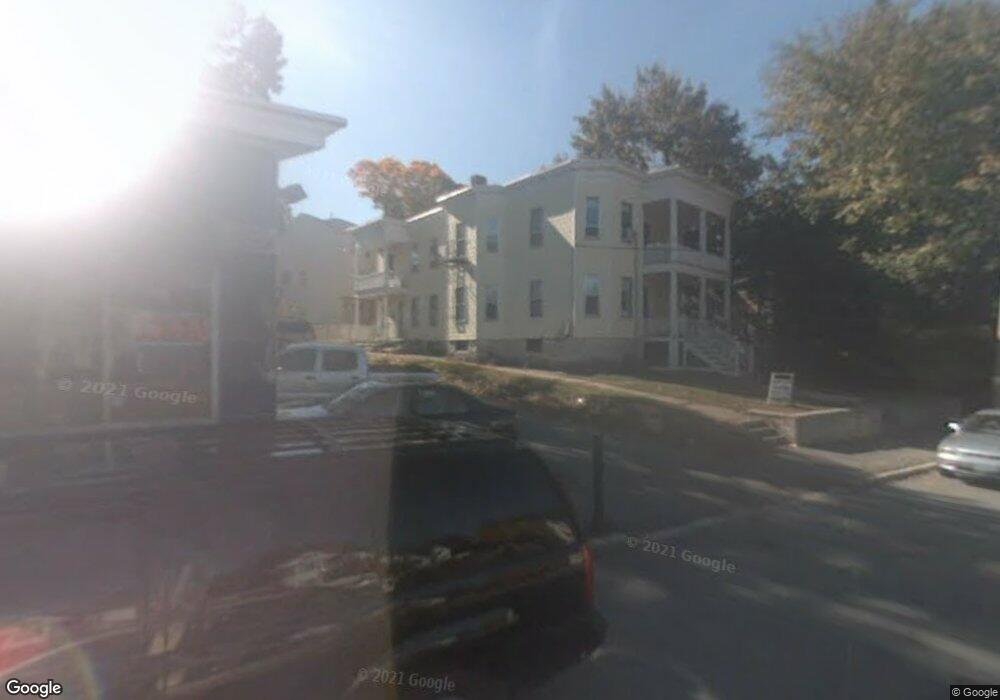
284 Branch St Lowell, MA 01851
Highlands NeighborhoodEstimated Value: $603,000 - $722,000
4
Beds
4
Baths
2,720
Sq Ft
$236/Sq Ft
Est. Value
About This Home
This home is located at 284 Branch St, Lowell, MA 01851 and is currently estimated at $643,000, approximately $236 per square foot. 284 Branch St is a home located in Middlesex County with nearby schools including Charles W. Morey Elementary School, Abraham Lincoln Elementary School, and Charlotte M. Murkland Elementary School.
Ownership History
Date
Name
Owned For
Owner Type
Purchase Details
Closed on
Apr 29, 2022
Sold by
Tea Peter and Tea Nhor
Bought by
Kim Sreyleak
Current Estimated Value
Home Financials for this Owner
Home Financials are based on the most recent Mortgage that was taken out on this home.
Original Mortgage
$240,000
Outstanding Balance
$224,835
Interest Rate
4.16%
Mortgage Type
Purchase Money Mortgage
Estimated Equity
$418,165
Purchase Details
Closed on
Dec 15, 2008
Sold by
Morales Juan C and Morales Lissette C
Bought by
Tea Nhor M and Tea Peter
Home Financials for this Owner
Home Financials are based on the most recent Mortgage that was taken out on this home.
Original Mortgage
$202,991
Interest Rate
6.49%
Mortgage Type
Commercial
Purchase Details
Closed on
Jan 29, 2002
Sold by
Ritchey Mark R and Ritchey Nicole N
Bought by
Morales Juan C and Morales Lissette C
Purchase Details
Closed on
Mar 16, 2001
Sold by
Lefebvre Maurice
Bought by
Ritchey Mark R and Ritchey Nicole N
Purchase Details
Closed on
Mar 9, 2000
Sold by
Loosigian Kevin
Bought by
Lefebvre Maurice
Create a Home Valuation Report for This Property
The Home Valuation Report is an in-depth analysis detailing your home's value as well as a comparison with similar homes in the area
Home Values in the Area
Average Home Value in this Area
Purchase History
| Date | Buyer | Sale Price | Title Company |
|---|---|---|---|
| Kim Sreyleak | $300,000 | None Available | |
| Tea Nhor M | $210,000 | -- | |
| Tea Nhor M | $210,000 | -- | |
| Tea Nhor M | $210,000 | -- | |
| Morales Juan C | $232,500 | -- | |
| Morales Juan C | $232,500 | -- | |
| Ritchey Mark R | $189,900 | -- | |
| Ritchey Mark R | $189,900 | -- | |
| Lefebvre Maurice | $115,000 | -- | |
| Lefebvre Maurice | $115,000 | -- |
Source: Public Records
Mortgage History
| Date | Status | Borrower | Loan Amount |
|---|---|---|---|
| Open | Kim Sreyleak | $240,000 | |
| Previous Owner | Tea Nhor M | $202,991 |
Source: Public Records
Tax History Compared to Growth
Tax History
| Year | Tax Paid | Tax Assessment Tax Assessment Total Assessment is a certain percentage of the fair market value that is determined by local assessors to be the total taxable value of land and additions on the property. | Land | Improvement |
|---|---|---|---|---|
| 2025 | $6,563 | $571,700 | $146,500 | $425,200 |
| 2024 | $6,207 | $521,200 | $131,800 | $389,400 |
| 2023 | $6,050 | $487,100 | $114,600 | $372,500 |
| 2022 | $5,620 | $442,900 | $104,200 | $338,700 |
| 2021 | $4,893 | $363,500 | $90,600 | $272,900 |
| 2020 | $4,377 | $327,600 | $79,200 | $248,400 |
| 2019 | $4,253 | $302,900 | $73,300 | $229,600 |
| 2018 | $3,717 | $268,100 | $66,700 | $201,400 |
| 2017 | $3,655 | $245,000 | $60,600 | $184,400 |
| 2016 | $3,416 | $225,300 | $57,800 | $167,500 |
| 2015 | $3,228 | $208,500 | $59,100 | $149,400 |
| 2013 | $3,109 | $207,100 | $70,700 | $136,400 |
Source: Public Records
Map
Nearby Homes
- 278 Branch St
- 290 Branch St
- 7 Dover St
- 264 Branch St Unit 1
- 264 Branch St
- 269 Branch St
- 265 Branch St
- 284 Wilder St
- 1099 Middlesex St
- 1105 Middlesex St
- 1092 Middlesex St
- 1117 Middlesex St Unit 1R
- 12 Dover St
- 263 Branch St
- 17 Dover St
- 1123 Middlesex St
- 16 Dover St
- 259 Branch St
- 292 Wilder St
- 292 Wilder St Unit 2